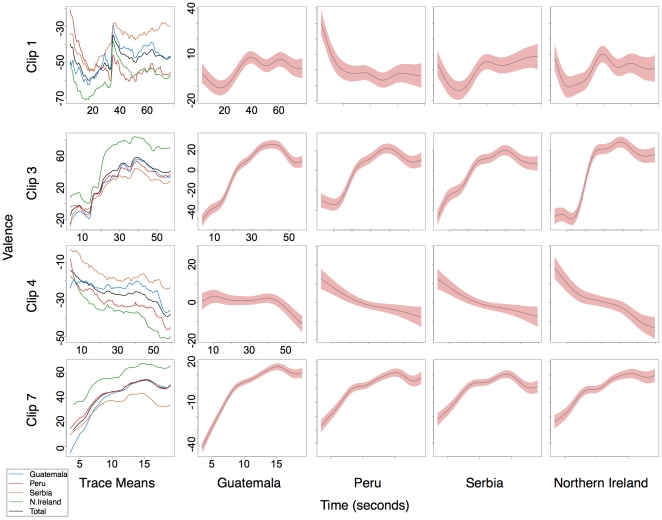
Figure 2. Trace means and generalized additive model terms with coefficients varying for each country for Clips 1, 3, 4 and 7.
Shaded red areas represent the 95% confidence intervals. Time in seconds is on the x axis, this differs for each clip. Valence is on the y axis the total range is from −100 to +100 here each clip covers a different range between 50 and 100 units.

