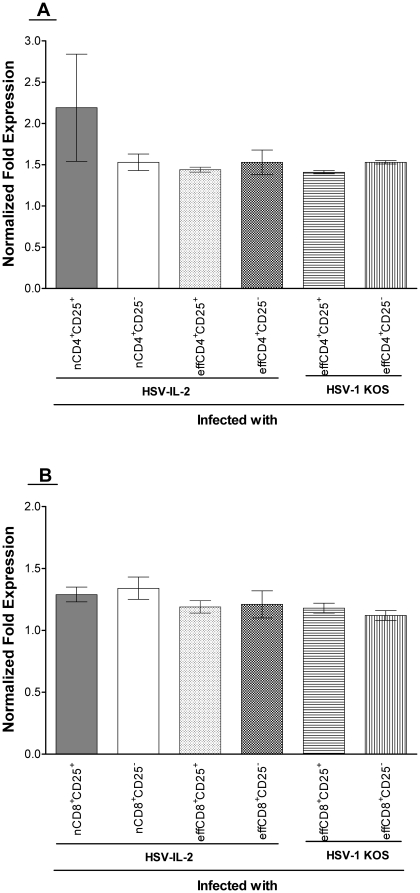
Figure 5. qRT-PCR analyses of FoxP3 transcript in brain of recipient SCID mice.
Total RNA from brains of SCID mice described in Fig. 4 and Table 1 was isolated on day 14 PI. FoxP3 expression in SCID mice infected with the virus and without T cells transfer was used to estimate the relative expression of FoxP3 transcript in brains of each group of recipient SCID mice. GAPDH expression was used to normalize the relative expression of each transcript in brain of each group of mice. Each point represents the mean ± SEM from 3 mice. Panels: A) FoxP3 transcript isolated from SCID mice received CD4+ T cells; and B) FoxP3 transcript isolated from SCID mice received CD8+ T cells.

