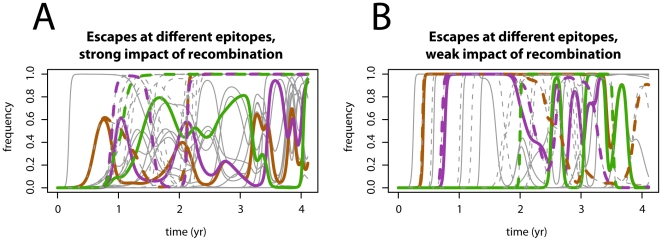
Figure 2. Example simulation runs of the virus escape dynamics.
Simulation runs without recombination are shown with solid lines, and with recombination with dashed lines. Plotted are frequencies of escapes at all  loci as a function of time, and in each case three chosen loci are printed in colour. Panel A shows an example simulation run for a parameter setting in which the impact of recombination is strong. Panel B shows an example simulation run for a parameter setting in which the impact of recombination is weak. Recombination mostly, but not always, accelerates the emergence and fixation of immune escapes. Parameters used in panel A:
  ,
, 
 ,
,  . Parameters used in panel B:
  ,
, 

 ; the remaining parameters are the same and are defined in Table 1.

