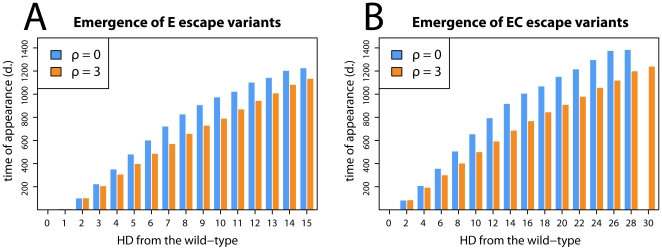
Figure 3. The average times of appearance of successive accumulations of escape mutations.
In both panels the time of emergence of mutants with a given number of escape mutations is shown. Orange and blue bars correspond to runs with and without recombination, respectively. A shows the time of appearance of E escapes (escapes at the escape locus). Panel B shows the time of appearance of EC escapes (escapes at the escape and compensatory locus). The simulations show that recombination accelerates the emergence of escape mutations. Parameters used:  ,
, 
 ; the others are defined in Table 1. The plot shows an average of 10000 simulation runs.

