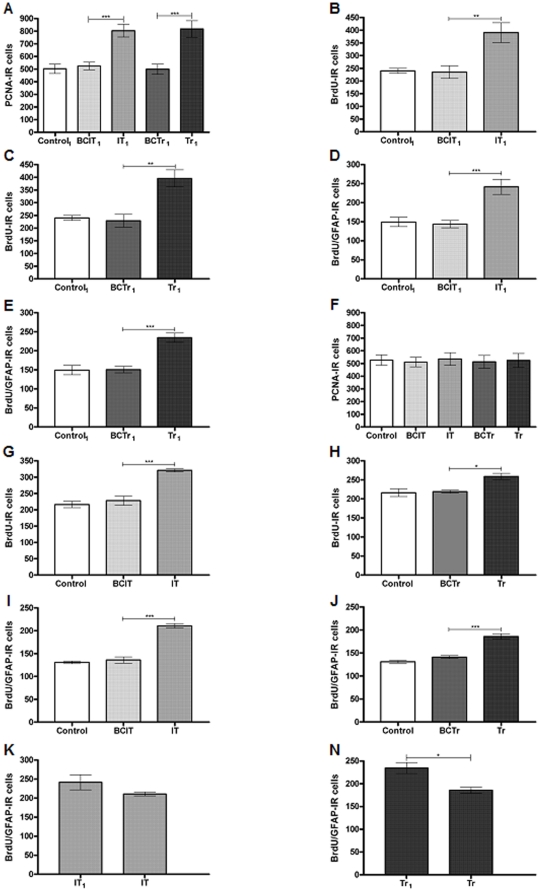
Figure 2. Cell proliferation and astrogliogenesisin the mPFC due to learning.
PCNA-IR in the mPFC are expressed as the mean ± sem (panel A and panel F). BrdU-IR and BrdU/GFAP-IR cells in the mPFC from animals sacrificed the same day after the last BrdU injection are expressed as the mean ± sem (panel B-E). BrdU-IR and BrdU/GFAP-IR cells in the mPFC from animals sacrificed one week after the last BrdU injection are expressed as the mean ± sem (panel G-J). BrdU/GFAP-IR cells from IT1, IT, Tr and Tr1 groups are are expressed as the mean ± sem (panel K-N). Control1 (n = 10); BCIT1, Box Control of IT1 (n = 10); IT1 (n = 10); BCTr1, Box Control of Tr1 (n = 10), Tr1 (n = 10), Control (n = 10); BCIT, Box Control of IT (n = 10); IT (n = 10); BCTr, Box Control of Tr (n = 10), Tr (n = 10). *p<0.05,**p<0.01,***p<0.001. One way ANOVA followed by Tukey's post hoc test.

