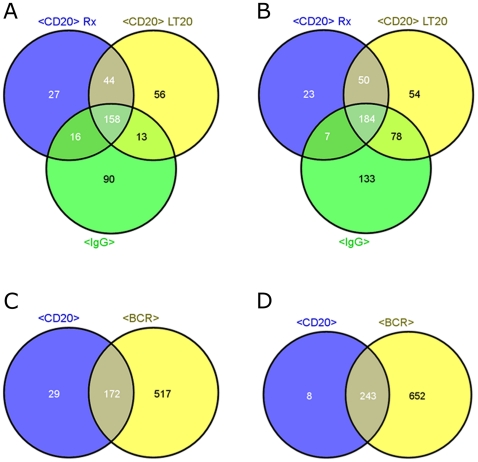
Figure 1. Comparison of genes deregulated by different antibody treatments.
Venn diagrams for numbers of up- (A) or down- (B) regulated genes in SUDHL4 after a 4 h incubation with 10 µg/ml anti-BCR antibody (anti-IgG) and anti-CD20 antibodies (Rituximab, LT20) and Venn diagrams for up- (C) or down- (D) regulated genes in REC1 after treatment with anti-BCR antibodies (anti-IgG and anti-IgM, respectively) and anti-CD20 antibodies (Rituximab, Rx-F(ab')2, LT20).

