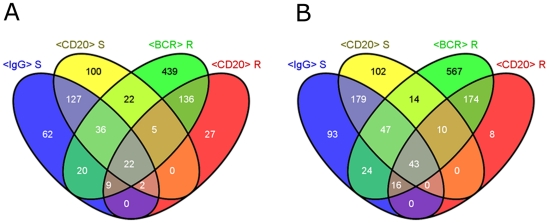
Figure 2. Comparison of anti-BCR and anti-CD20.
Venn diagrams of “Union lists” of up- (A) or down- (B) regulated genes after different treatments. Cells were incubated with 10 µg/ml antibody for 4 h. Lists of similar treatments were united to “Union lists” for CD20 or BCR treatment for each cell line R = REC1, S = SUDHL4.

