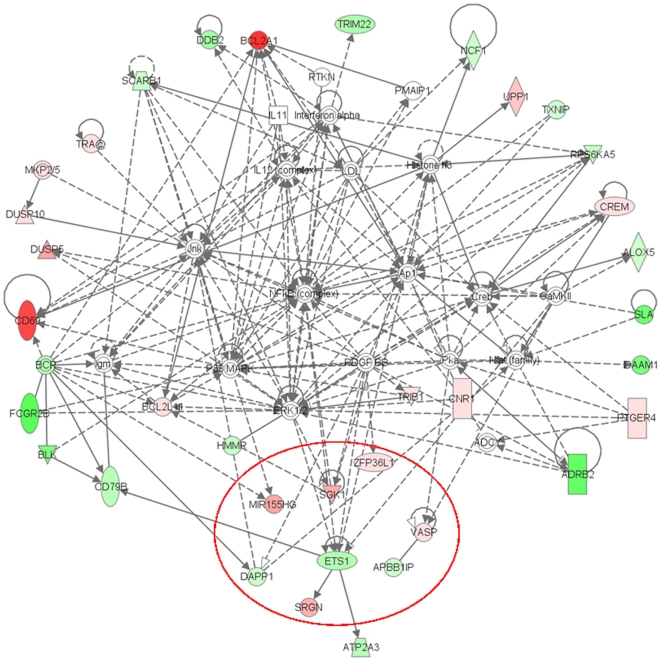
Figure 4. Interactions between deregulated genes.
IPA generated network of interactions between genes deregulated by anti-CD20 antibodies in SUDHL4 and REC1. The red circle marks genes which are also deregulated by all anti-BCR treatments. Interestingly this unbiased analysis displays deregulations of BCR components and the downstream signaling pathway.

