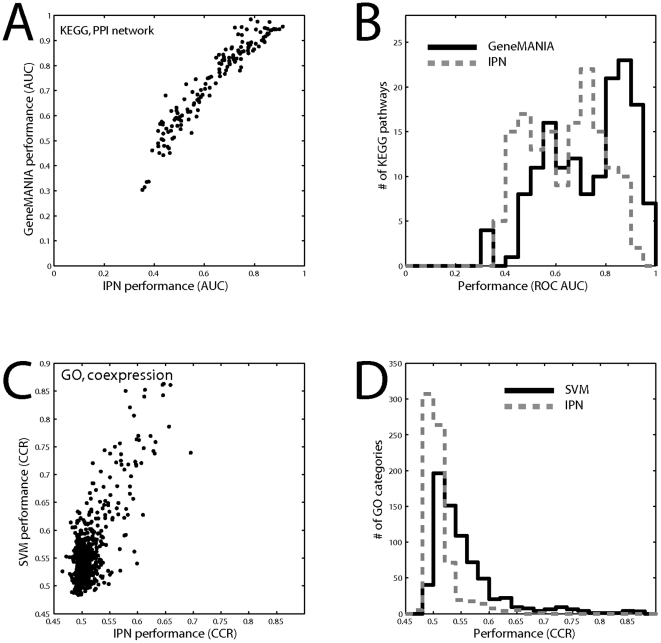
Figure 3. Individual property network (IPN) performance.
Individual property networks are constructed by thresholding the self-outer product of the node degree for a given association matrix. A) The performance of an IPN protein interaction network is compared to the performance using GeneMANIA for the interaction network across all KEGG groups. B) The true protein interaction network performance is high but comparable to its IPN performance. C) The performance of an IPN using coexpression data across GO groups. D) The coexpression matrix gives low performance across GO groups but it is IPN performance is considerably worse. Only data in which some interaction is present within a given GO group – the learnable groups - is shown.

