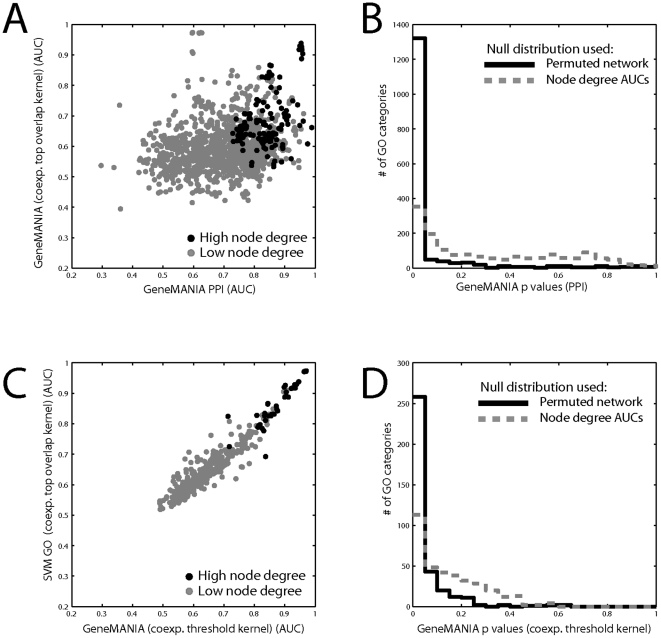
Figure 4. Controlling for node degree.
A) True prediction performance is compared for the same method (GeneMANIA) using entirely different strongly predictive data sets (Protein interaction vs. coexpression) across GO groups. The performance is quite different, but when average node degree is higher in both datasets (top 5% by product, dark circles), then common performance is high. B) The statistical significance of the protein interaction results are computed using the usual permutation test (black) and using the distribution generated by the node degree scores (grey). C) True prediction performance is compared using the same underlying data (coexpression), processed differently (threshold vs. top overlap) and analyzed differently (SVM vs. GeneMANIA). Performance is strongly similar. D) The statistical significance of the weakly performing threshold coexpression results are computed using the permutation test (black) and the node degree vector (grey). Only data in which some interaction is present within a given GO group – the learnable groups – was used.

