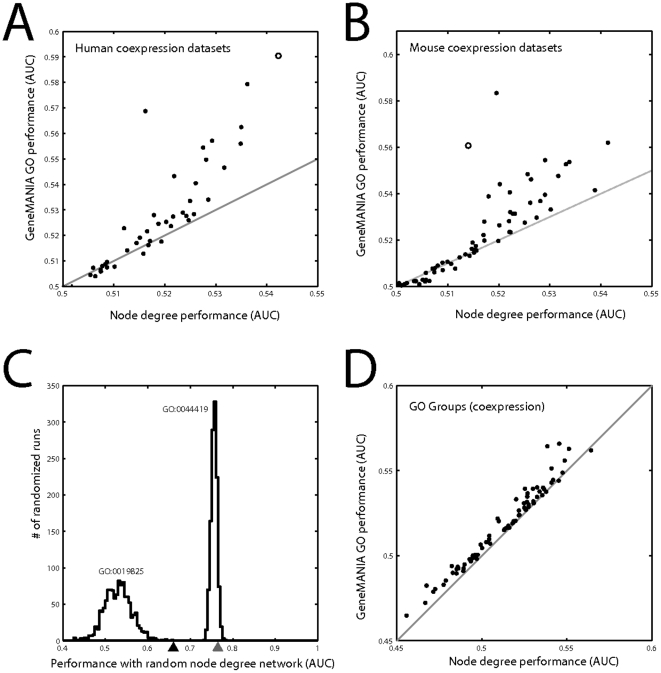
Figure 5. Performance across experiments.
A) Coexpression performance in GO slim assessed as a function of using node degree ranking in human microarray datasets. Each point represents a single experimental set, with the open circle representing the aggregated association matrix. The identity line – representing no improvement beyond performance using node degree alone – is shown. B) Coexpression performance assessed as a function of node degree ranking in mouse microarray datasets. The open circle is the Su et al dataset. C) Random association matrices of fixed node degree were generated to generate a distribution of performances for two GO groups. Performance predicting membership using the original interaction matrix network is shown by arrowheads below the X axis (black: GO:001985; grey: GO:0044419). D) Performance of each GO slim group in the human data is plotted as a function of performance of the group using the node degree ranking.

