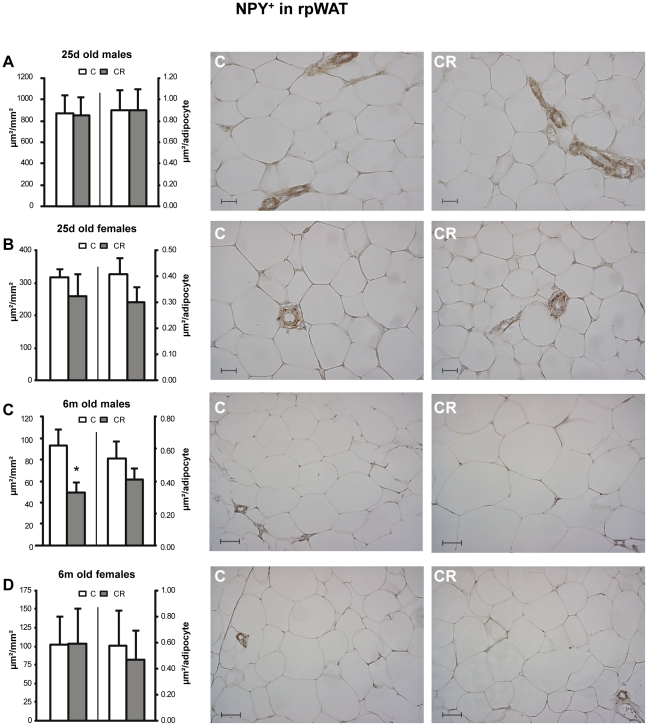
Figure 4. Immunohistochemical analysis of NPY in rpWAT depot.
Immunoreactive NPY area (NPY+) - expressed as µm/mm2 (left axis) and as µm/adipocyte (right axis) - in retroperitoneal white adipose tissue (rpWAT) of 25 d (A and B) and 6 m (C and D), male (A and C) and female (B and D) offspring of controls (C) and 20% caloric restricted dams during gestation (CR) and their corresponding representative immunostained sections (C on the left and CR on the right). Scale bar: 20 µm and 50 µm for 25 d old and 6 m old animals respectively. Data are mean ± s.e.m. (n = 5–6, coming from at least four different litters). For each animal, 16–20 measurements were performed in different random fields coming from two non consecutive sections of the tissue (7–10 fields per section).* Different from their respective C group (p<0.05; Student's t -test).

