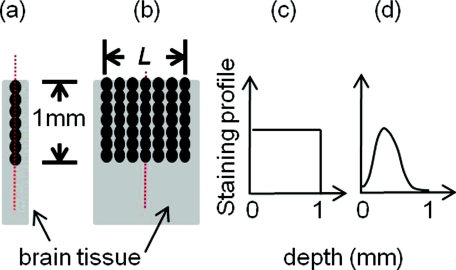
Figure 2.
Distributions of point disturbance in the absorption and fluorescence imaging. Absorption imaging: (a) A single array of point absorbers evenly distributed throughout the cortical depth (0–1 mm) and along the optical axis. (b) Multiple arrays of point absorbers evenly distributed throughout the cortical depth (0–1 mm) and with a lateral size of L. Fluorescence imaging: the distribution of a single array and multiple arrays of fluorescent targets are shown in (a, b), respectively. Their normalized staining profile can be either uniform (c) or nonuniform (d).

