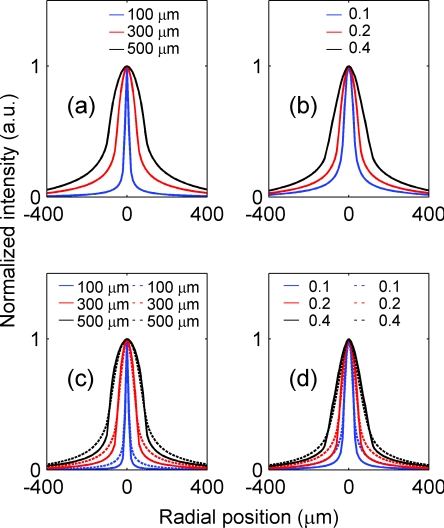
Figure 6.
Spatial profiles of the difference images due to the presence of a single array of point absorbers (or fluorescent targets) for both the absorption and fluorescence imaging. (a) The spatial profiles corresponding to NA = 0.2 and focal plane depths at 100 (blue), 300 (red), and 500 μm (black), respectively, for the absorption imaging. (b) The spatial profiles corresponding to three different NA at 0.1 (blue), 0.2 (red), and 0.4 (black), respectively, and focal plane depth = 300 μm for the absorption imaging. (c) The spatial profiles corresponding to NA = 0.2 and focal plane depths at 100 (blue), 300 (red), and 500 (black) μm, respectively, for the fluorescence imaging. (d) The spatial profiles corresponding to three different NA at 0.1 (blue), 0.2 (red), and 0.4 (black), respectively, and focal plane depth = 300 μm for the fluorescence imaging. In (c, d), straight and dashed lines represent the profiles corresponding to uniform and nonuniform distributions of the fluorescent targets, respectively.

