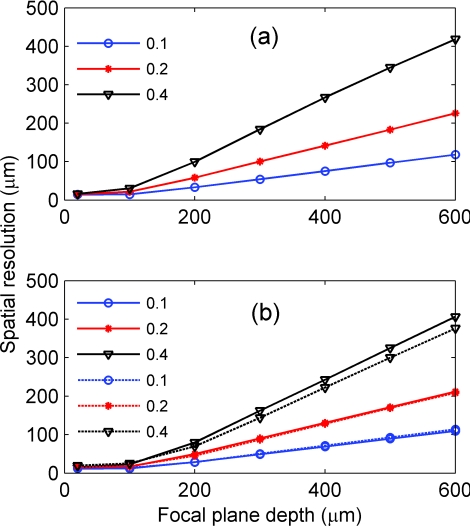
Figure 7.
Spatial resolution versus focal plane depth of the (a) absorption and (b) fluorescence imaging for NA of 0.1 (circle), 0.2 (star), and 0.4 (triange), respectively. In (b), straight and dashed lines represent the profiles corresponding to uniform and non-uniform distributions of the fluorescent targets, respectively.

