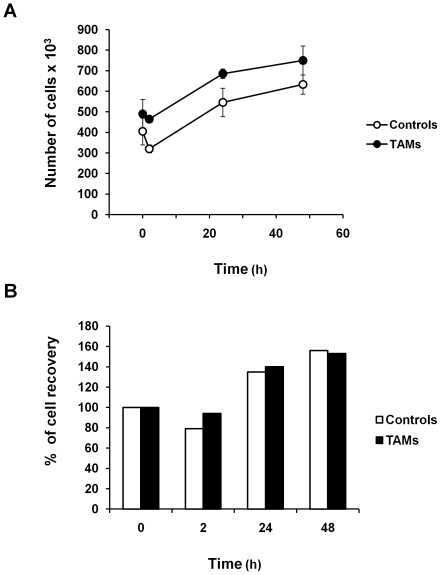
Figure 2. Growth curve of untreated control monocytes and TAMs after L. monocytogenes infection.
Cells were infected as described in Materials and Methods. After the infection, samples were taken at the indicated periods of time, and number of viable cells was assayed by trypan blue exclusion. The data are presented as number of viable cells (panel A) and as percentage of cell recovery, being 100% of recovery at time 0 (panel B). Mean ± SEM of six independent experiments.

