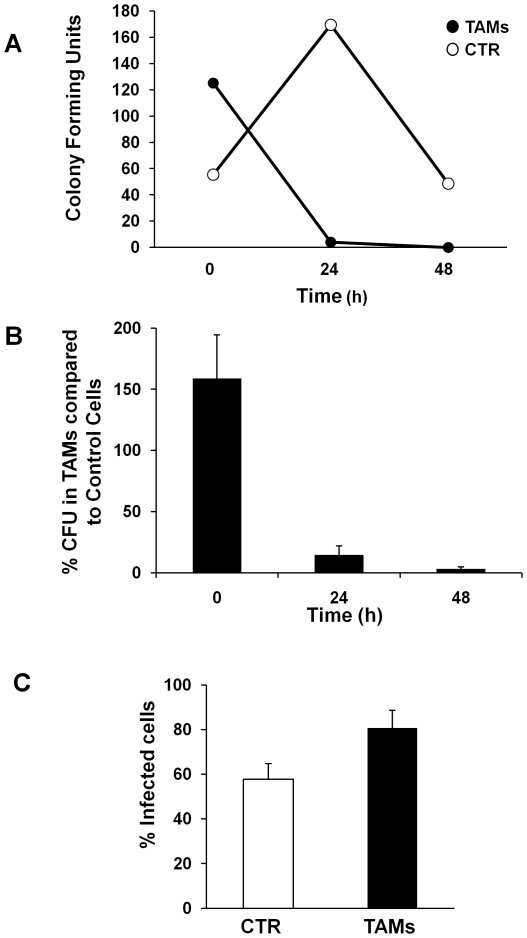
Figure 3. TAMs control replication of Listeria monocytogenes.
A. Intracellular growth curve of L. monocytogenes. Cells were infected for 30 minutes at 37°C with a multiplicity of infection of 25∶1 bacteria per cell, and medium containing 100 µg/ml gentamicin was added for 1 h to kill extracellular bacteria (0 h). Cells were washed and RPMI supplemented with 5 µg/ml gentamicin was added. At the indicated periods of time, 3×10⁵ cells were lysed and colony forming units CFU were quantified, as described in Materials and Methods. A representative experiment is shown. B. Summary of the growth curves of L. monocytogenes. The data are presented as percentage of the number of CFU recovered in TAMs relative to the number of CFU recovered in control monocytes (mean ± SEM of five independent experiments). C. Cells were infected with L. monocytogenes for 30 minutes at 37°C with a MOI 25∶1 and medium containing 100 µg/ml gentamicin was added for 1 h to kill extracellular bacteria. Intracellular bacteria were detected by immunofluorescence analysis as described in Materials and Methods (mean ± SEM of five independent experiments).

