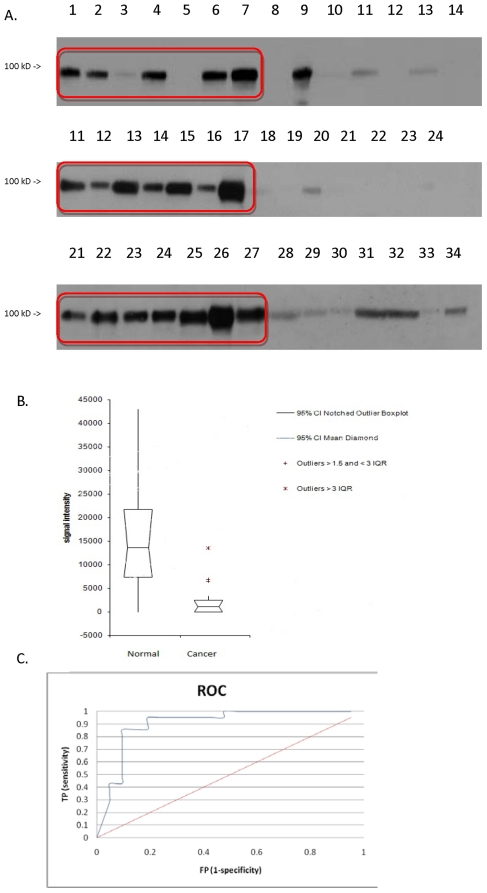
Figure 2. Western blot results.
A: Western blots for EL on control and gastric cancer samples. Control samples (denoted by the red lined box): Lanes 1–7, 11–17, 21–27. Cancer samples: Lanes 8–14, 18–24, 28–34. B: Corresponding whisker-box plot for the signal intensities. C. ROC curve of the EL Western blot. Red line: no discrimination; blue line: ROC by EL.

