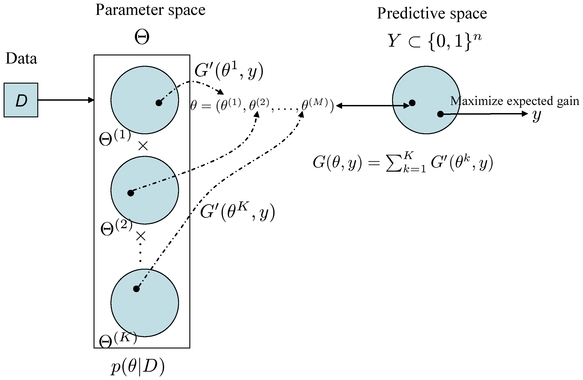
Figure 2. Schematic diagram of the representative estimator (Definition 10).

The parameter space  is a product space and is different from the predictive space
  .
.

The parameter space  is a product space and is different from the predictive space
  .
.