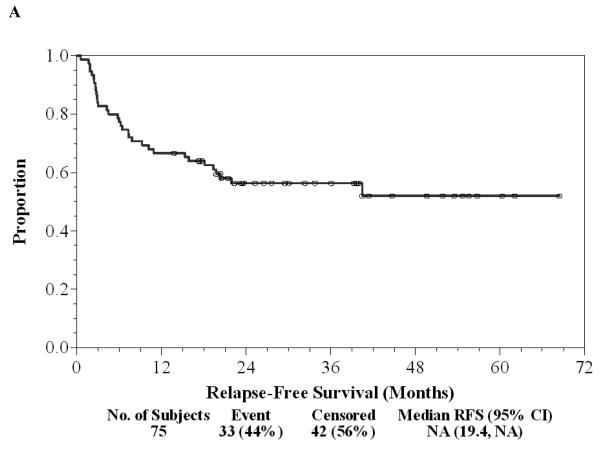
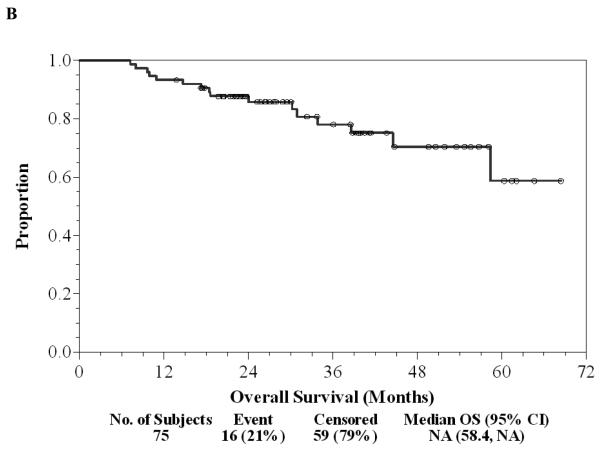
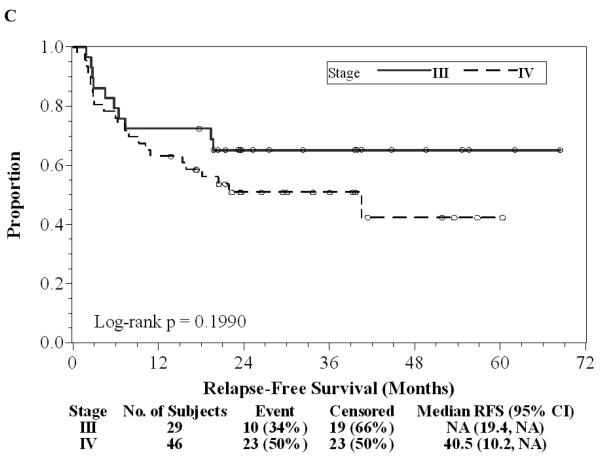
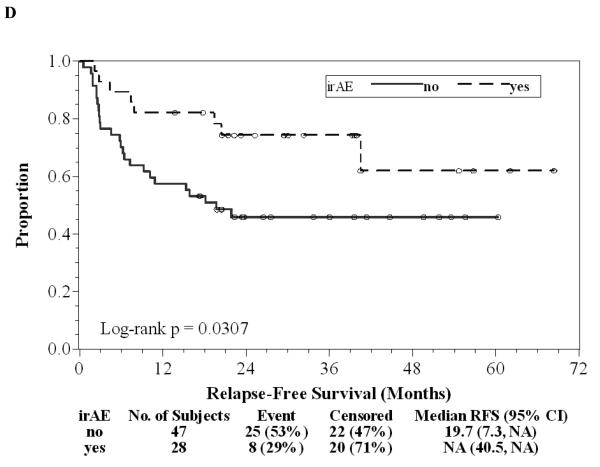
Figure 1. Patient outcomes.
A, Kaplan-Meier relapse-free survival curve for all patients treated with ipilimumab. B, Kaplan-Meier overall survival curve for all patients treated with ipilimumab. C, Kaplan-Meier relapse-free survival curves comparing Stage IIIc patients (solid) to Stage IV patients (dashed). D, Kaplan-Meier relapse-free survival curves comparing patients with irAE (dashed) to patients without irAE (solid). “o” indicates censored observations.


