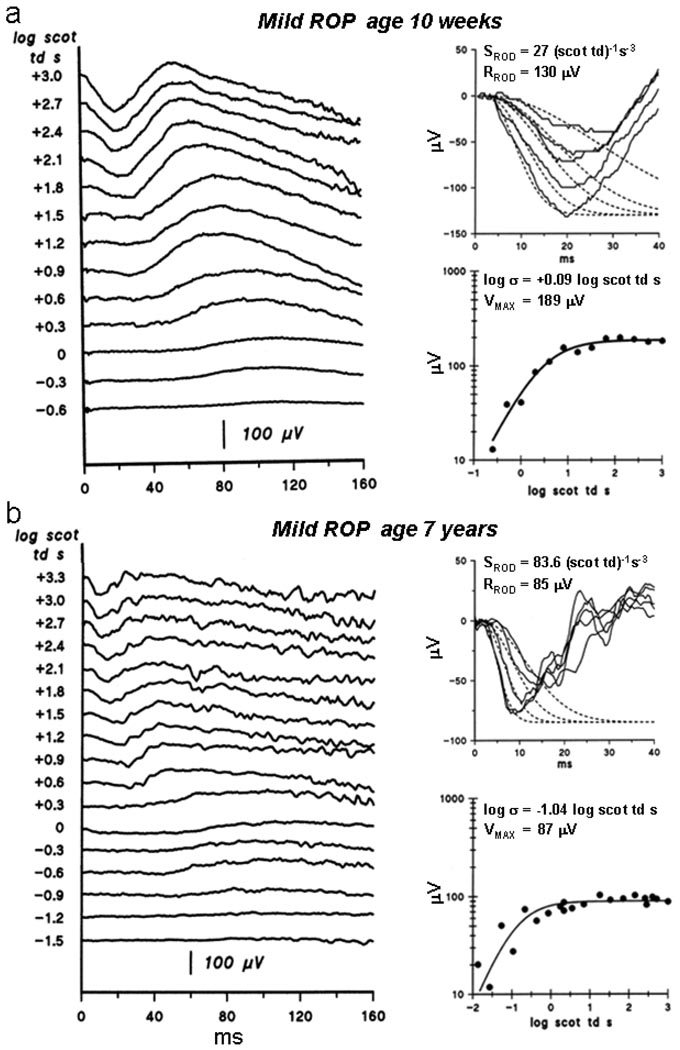
Fig. 1.
Sample ERG records from mild ROP subjects. a. ERGs recorded using a Burian-Allen contact electrode and model fits to a- and b-waves in a 10 week old infant with a history of mild ROP. Left: Dark adapted ERG responses to a series of flashes. Flash intensity in log scot td s is indicated to the left of the traces. Upper right: The first 40 ms of the response (solid lines) to the five brightest flashes and model fits to the a-wave (Eq. 1, dashed lines). The calculated values of SROD and RROD are indicated. Lower right: b-wave amplitude plotted as a function of stimulus intensity. The smooth curve represents Eq. 2 fit to the points. The calculated values of log σ and VMAX are indicated. b. ERGs recorded using skin electrodes in a 7 year old child with a history of mild ROP. The features are the same as in a.

