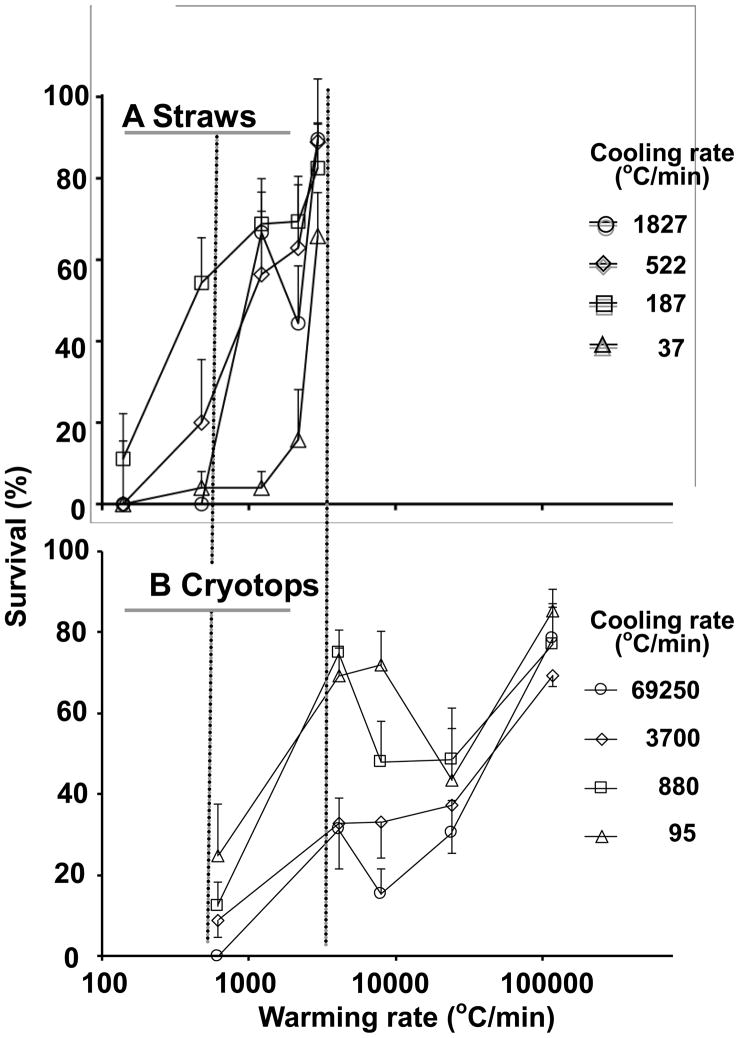
Fig. 6.
Like Fig. 5 except that survival is plotted as a function of warming rate for oocytes subjected to four different cooling rates in (A) straws and (B) Cryotops. The two dotted vertical lines demarcate the region where the warming rates overlap in A and B

