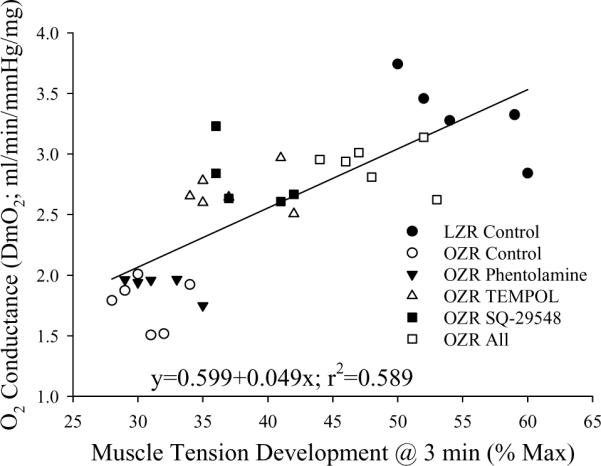
Figure 8.

Correlation between O2 conductance (DmO2) and muscle performance in LZR (n=5) and OZR (n=5–6) in response to three minutes of muscle contraction at a frequency of 5Hz. Values are presented under control conditions and following treatment of OZR with phentolamine (10 mg/kg), TEMPOL (50 mg/kg), SQ-29548 (10 mg/kg) or all three substances. Data are presented for individual animals and the equation for the line of best fit is determined using a least squares analysis.
