
Fig. 2.
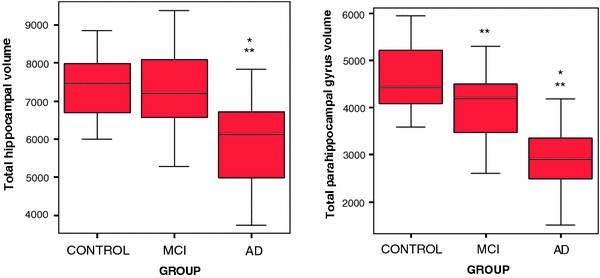
Boxplot of the hippocampal and parahippocampal gyrus volumes in mm3 in controls, MCI and AD patients. **significant difference with control group; *significant difference with MCI group
Official websites use .gov
A
.gov website belongs to an official
government organization in the United States.
Secure .gov websites use HTTPS
A lock (
) or https:// means you've safely
connected to the .gov website. Share sensitive
information only on official, secure websites.
Boxplot of the hippocampal and parahippocampal gyrus volumes in mm3 in controls, MCI and AD patients. **significant difference with control group; *significant difference with MCI group