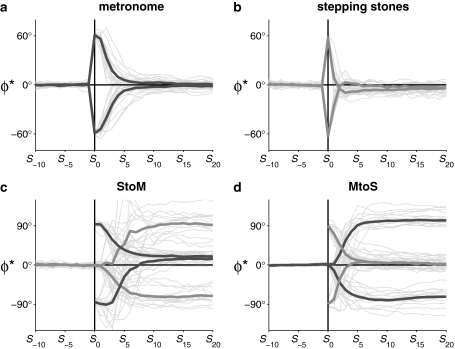
Fig. 4.
Relative phase time series for S −10 to S 20 for perturbation (a, b) and switching (c, d) conditions. Thin and thick lines represent individual and averaged relative phase time series, respectively. Dark and bright thick gray lines represent relative phase time series of footfalls with metronome beeps (M) and stepping stones (S), respectively

