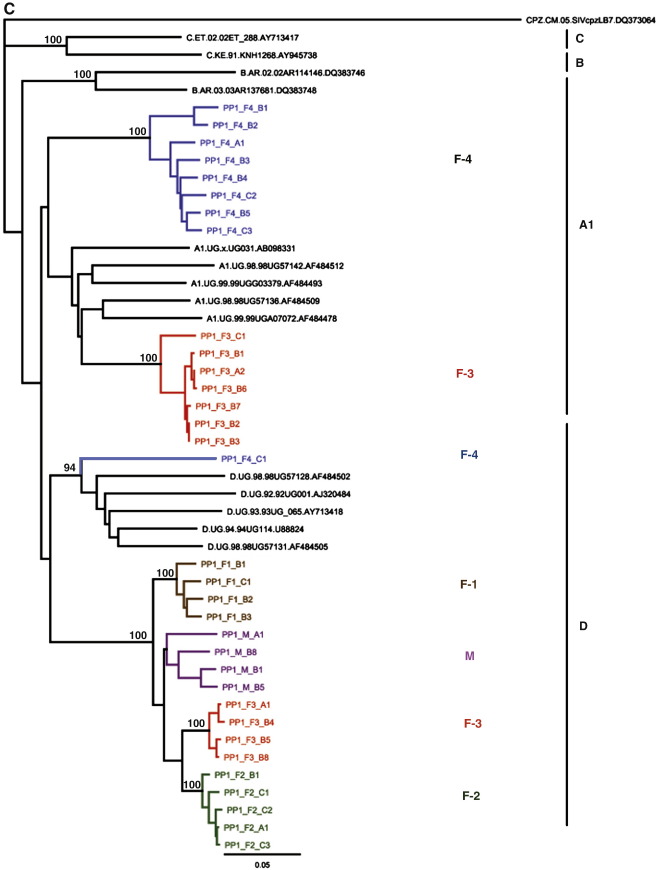
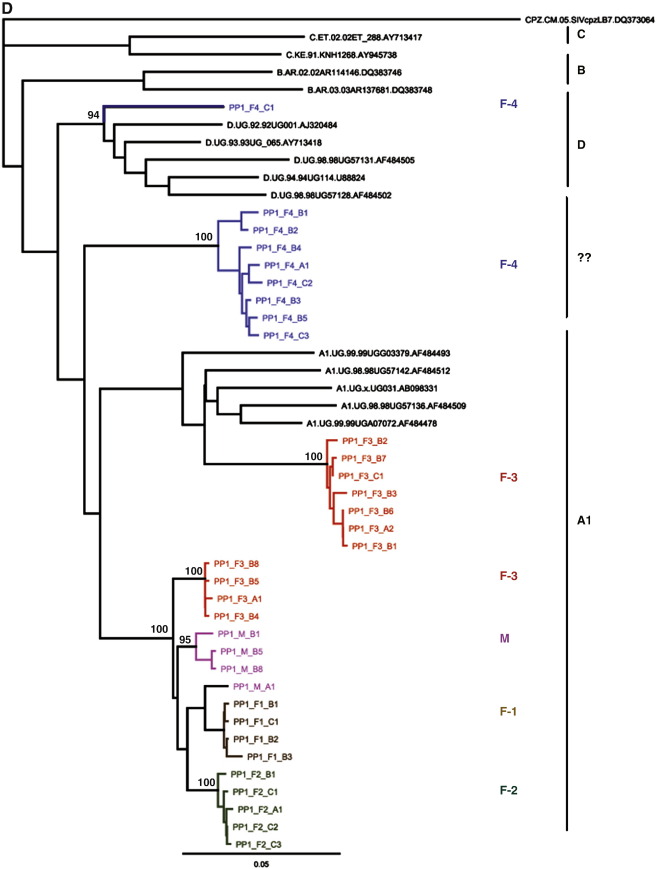
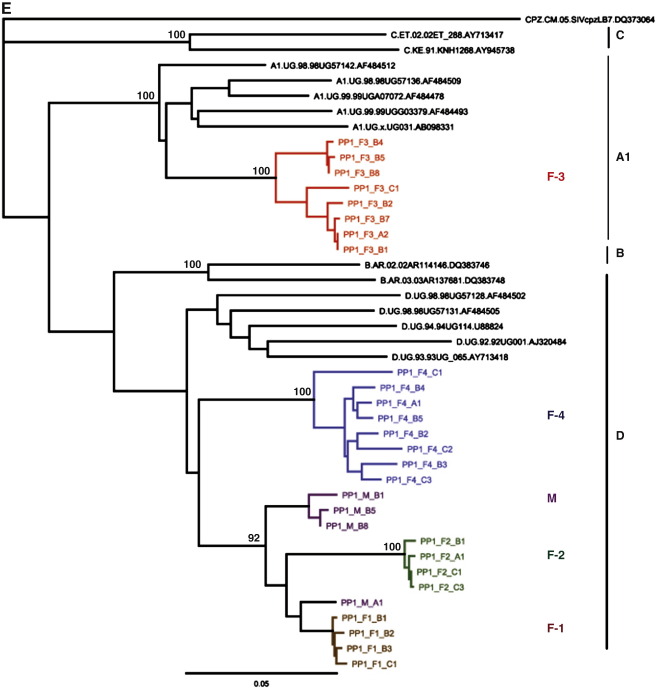
Fig. 2.
A. Phylogenetic analysis of the first SGA fragment (approx. 1000 bps) sequences in Polygamous Partnership 1. Bootstrap values greater than 90% are shown. M—male partner and F—female partner. B. Phylogenetic analysis of the second SGA fragment (approx. 1000 bps) sequences in Polygamous Partnership 1. Bootstrap values greater than 90% are shown. M-Male partner and F-Female partner. C. Phylogenetic analysis of the third SGA fragment (approx. 1000 bps) sequences in Polygamous Partnership 1. Bootstrap values greater than 90% are shown. M—male partner and F—female partner. D. Phylogenetic analysis of the fourth SGA fragment (approx. 1000 bps) sequences in Polygamous Partnership 1. Bootstrap values greater than 90% are shown. M—male partner and F—female partner. E. Phylogenetic analysis of the fifth SGA fragment (approx. 1000 bps) sequences in Polygamous Partnership 1. Bootstrap values greater than 90% are shown. M—male partner and F—female partner.


