

Abstract
Purpose
Pericardial adipose tissue may exert unique metabolic and cardiovascular risks. Cardiac multi-detector computed tomography (MDCT) imaging may enable accurate localization and quantification of pericardial and intra-thoracic adipose tissue. The reproducibility of ECG-gated high-resolution cardiac MDCT-based volumetric quantification of pericardial and intra-thoracic adipose tissue has not been reported.
Methods
We included 100 consecutive patients (age: 54.5 ± 12.0 yr, 60% men) who underwent a standard contrast-enhanced coronary CT for the evaluation of coronary artery plaque and stenosis (64-slice MDCT, temporal resolution: 210 ms, spatial resolution: 0.6 mm, 850 mAs, 120, kvp) following a presentation of acute chest pain. Two independent observers measured intra-thoracic (IAT) and pericardial adipose tissue (PAT) using a semiautomatic segmentation algorithm based on three-dimensional analysis.
Results
Inter-reader reproducibility was excellent (relative difference: 7.35 ± 7.22% for PAT and 6.23 ± 4.91% for IAT, intra-class correlation (ICC) 0.98 each). Similar results were obtained for intra-observer reproducibility (relative difference: 5.18 ± 5.19% for PAT and 4.34 ± 4.12% for IAT, ICC 0.99 each).
Conclusion
This study demonstrates that MDCT-based 3D semiautomatic segmentation for volumetric quantification of pericardial and intra-thoracic adipose tissue is highly reproducible. Further research is warranted to assess whether volumetric measurements may substantially improve the predictive value of obesity measures for insulin resistance, type 2 diabetes mellitus, and cardiovascular diseases.
Keywords: Computed Tomography, Pericardial Adipose Tissue, Reproducibility
Introduction
The recent rise in the prevalence of obesity throughout all age groups1–3 is particularly concerning due to its potential accelerating effect on cardiovascular disease (CVD), as obesity is a well-established risk factor for the development of coronary artery disease4–6. Several recent studies have highlighted that different compartments of adipose tissue may exert unique metabolic and cardiovascular risks7. Abdominal visceral adipose tissue in particular is associated with multiple cardiovascular risk factors, including hypertension, impaired fasting glucose, and metabolic syndrome8.
Pericardial adipose tissue (PAT) may also play a role in obesity-related vascular disease. PAT is correlated with body mass index,9 visceral abdominal adipose tissue,10, 11 insulin resistance,12, 13 and coronary artery disease9, and has been shown to be a rich source of inflammatory mediators in high-risk cardiac patients10. Additionally, in a study of Japanese males, PAT was demonstrated to be more strongly associated with coronary artery disease morbidity in non-obese men than other body fat distributions11.
It has been demonstrated that multi-detector computed tomography (MDCT)-based measurements of adipose tissue depots are highly reproducible14, 15, including volumetric measurements of PAT in non-contrast-enhanced cardiac ECG-triggered MDCT12.
The goal of this study was to establish and evaluate a standardized volumetric assessment of pericardial and intra-thoracic adipose tissue (IAT) in standard high-resolution, ECG-gated, contrast-enhanced coronary MDCT data sets.
Materials and Methods
Subjects
We selected 100 consecutive patients who presented with acute chest pain in the ED and underwent standard contrast-enhanced coronary CT angiography (CTA) as part of a prospective blinded observational cohort study (The Rule Out Myocardial Infarction Using Computer Assisted Tomography “ROMICAT” Study)16. Exclusion criteria included positive initial cardiac enzymes (troponin or CK-MB), diagnostic EKG changes, unstable clinical status (hemodynamically unstable, ventricular tachycardia or persistent chest pain despite adequate therapy), serum creatinine > 1.3 mmol/l, known allergy to iodinated contrast, history of asthma, previous intolerance to beta-blocker, or atrial fibrillation. The institutional review board approved this study. All patients provided written consent. The demographics of our population are shown in Table 1.
Table 1.
Subject Demographics
| Overall Cohort (n=100) | Female (n=40) | Male (n=60) | |
|---|---|---|---|
| Age yr (mean ± stdv), Range | 54.5 ± 12.0, 36–85 | 58.7 ± 10.7, 41–85 | 51.7 ± 12.2, 36–84 |
| BMI kg/m2 (mean ± stdv), Range | 29.5 ± 8.5, 19.3–88.2 | 30.2 ± 11.3, 19.3–88.2 | 29.1 ± 6.0, 20.8–52.9 |
| Diabetes | 13 (13%) | 4 (10%) | 9 (15%) |
| Hypertension | 44 (44%) | 21 (53%) | 23 (38%) |
| Hyperlipidemia | 46 (46%) | 17 (43%) | 29 (48%) |
| History of CAD* | 14 (14%) | 2 (5%) | 12 (20%) |
| Current Statin Use | 32 (32%) | 11 (28%) | 21 (35%) |
| Current Daily Aspirin Use | 31 (31%) | 10 (25%) | 21 (35%) |
| Family History of CAD** | 24 (24%) | 8 (20%) | 26 (43%) |
| Smoker*** | 55 (55 %) | 19 (48%) | 36 (60%) |
| Cocaine*** | 15 (15%) | 2 (5%) | 13 (22%) |
Previous MI, stent, balloon angioplasty, or coronary artery bypass surgery
First degree relative with documented premature MI or sudden cardiac death (men < 55 yrs, women < 65 yrs)
Current or former
CT Coronary Angiography
Data Acquisition: CT imaging was performed using a 64-slice CT scanner (“Sensation 64”; Siemens Medical Solutions, Forchheim, Germany). All patients with a heart rate > 60/min received a beta-blocker (intravenous metoprolol, 5–20 mg) unless their systolic blood pressure was <100 mmHg, or other contraindications were present. All image acquisitions were performed during a single breath hold in inspiration.
After a test bolus of 20 ml contrast agent (Iodhexodol 320 g/cm3, Visipaque, General Electrics Healthcare, Princeton, NJ, USA) to determine optimal timing, a contrast agent was injected intravenously at a rate of 5 ml/s to ensure homogeneous contrast enhancement of the entire coronary artery tree. Images were acquired with 64 × 0.6 mm slice collimation, a gantry rotation time of 330 ms, tube voltage of 120 kV, and an effective tube current of 850 mAs using ECG-correlated tube current modulation.
Trans-axial images were reconstructed with a slice thickness of 0.75 mm and increment of 0.4 mm using a retrospectively ECG-gated half-scan algorithm with a temporal resolution of 165 ms. Images were initially reconstructed at 65% of the cardiac cycle17. If necessary, additional reconstructions were performed to minimize motion artifacts. Reconstructed CT data sets were anonymized and transferred to an offline workstation (Leonardo; Siemens Medical Solutions, Forchheim, Germany). Measurement of pericardial adipose tissue volumes were performed using the dataset with the least image artifacts selected also for the assessment of the coronary artery plaque and stenosis.
Measurement of Adipose Tissue
Two experienced observers performed an analysis of all data sets in random order to assess for inter-observer variability (JHN and BS), blinded to the readings by the other observer. Both readers repeated the analysis one week later in a random subset of 20 patients to assess for intra-observer variability. Both readers measured intra-thoracic and pericardial adipose tissue volumes (IAT and PAT; cm3) on an offline workstation (Leonardo; Siemens Medical Solutions, Forchheim, Germany) using a dedicated semiautomatic software program (Volume Viewer, Siemens Medical Solutions, Forchheim, Germany). For measurement purposes, PAT is defined as epicardial adipose tissue contained within the boundary defined by the parietal layer of the pericardial sac. IAT is defined as all paracardial and epicardial fat contained within the mediastinum. IAT includes all PAT. All measurements were made using the axial data set from the CTA image selected for the assessment of coronary artery plaque and stenosis. A planar region of interest (ROI) was traced every 10 mm, and interpolation between the individual planar ROIs from the superior to inferior boundary created the volume of interest. To balance clinical feasibility with an increase in accuracy as compared to the previous study by Wheeler et al.12, we determined prospectively that 10 mm is the optimal interval for delineation of the pericardial sac when measuring pericardial adipose tissue volume. The display settings were chosen to maximize the contrast between the pericardium and the surrounding tissue and a standard display setting of window: 750 HU and level: 200 HU was applied. When necessary, the reader made manual adjustments through the scan volumes to account for interpolating errors. The following anatomic landmarks were used to define the boundaries of the region/volume of interest (Figure 1).
Figure 1.
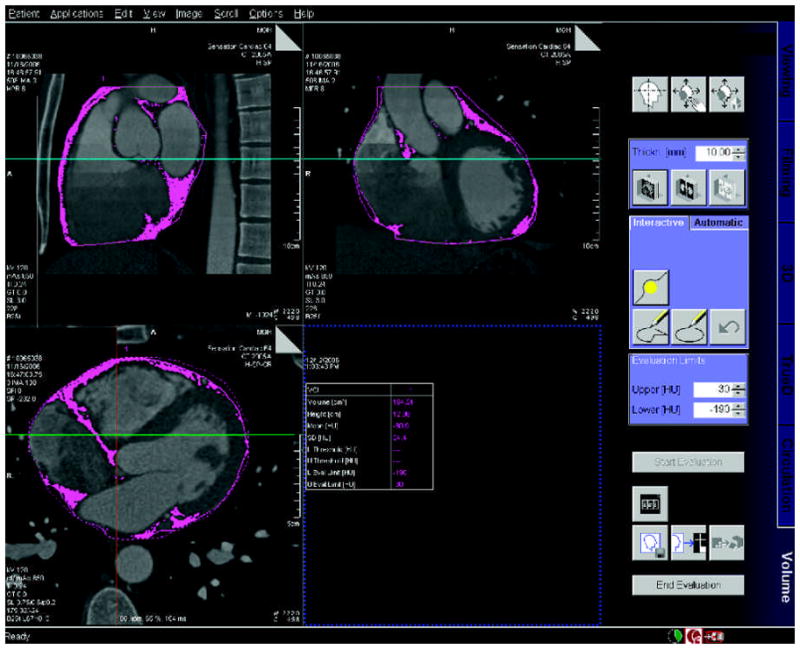
Demonstration of semi-automated detection of pericardial adipose tissue: axial, sagittal, and coronal cross-sections of 40 year-old male, with shaded regions representing pericardial adipose tissue. Note the focus of adipose tissue in the both Atrial-Ventricular grooves and along the intra-ventricular septum.
For PAT
superior boundary: center of the right pulmonary artery as displayed in the sagittal plane; inferior boundary: diaphragm, with special interest to exclude non-pericardial adipose tissue; anterior boundary: pericardial sac as viewed in the axial plane; and posterior boundary: Pericardial sac as viewed in the axial plane.
PAT volume was determined via tracing of the pericardial sac as viewed in the axial image with 10 mm slice thickness. Superiorly, the outline of the roots of the great vessels was traced until the pericardial sac was visualized. Once visualized, the pericardial sac was traced iteratively until the apex of the heart, with special care to exclude sub-diaphragmatic abdominal adipose tissue. The pericardial sac is traced in the axial image using the outer edge of the parietal layer of the serous pericardium.
For IAT
superior and inferior boundaries were similar to PAT; anterior boundary: sternum; posterior boundary: anterior wall of the descending aorta encompassing all non-diaphragmatic adipose tissue within the thorax.
To overcome uncertainty with regard to the diaphragmatic inferior border for both IAT and PAT, the accuracy of tracings was controlled in the sagittal and coronal planes. This minimizes the possibility of including sub-diaphragmatic abdominal adipose tissue. In this inferior region, strict adherence to tracing only the pericardial sac was maintained.
Absolute Hounsfield Units (HU) values of pixels correspond directly to tissue property. To distinguish adipose tissue from other structures within the volume of interest all pixels between −190 to −30 HU were defined as adipose tissue12. Using these standard settings, the adipose tissue volumes of PAT and IAT were automatically determined across the total available imaging volume and were measured in cm3.
Measurement of Scan Image Quality
Readers had full access to scroll through axial images, to interactively perform multi-planar reconstructions in thin slices and maximum intensity projections (MIP), and to create curved multi-planar reformats of any of the three datasets. Readers inspected all coronary artery segments (modified 17-segment classification of the American Heart Association18) and determined image quality as follows: Overall image quality was assessed using a five-point ranking scale [19–21]. A score of 5 (excellent) was given in the absence of motion artifacts and a clear delineation of the coronary vessels; a score of 4 (good) was given if minor artifacts and mild blurring of the coronary vessels was noted; a score of 3 (fair) was given if moderate artifacts and moderate blurring without structure discontinuity of the coronary vessels; a score of 2 (poor) was given if severe artifacts, doubling or discontinuity in the course of the coronary vessels; and a score of 1 (unreadable) was given if the dataset is not evaluable and vessel structures are not differentiable from surrounding tissues.
Statistical Evaluation
Descriptive characteristics for all variables were expressed as mean ± SD for continuous variables and percentages for categorical variables. Inter- and intra-observer reproducibility was assessed using the intra-class correlation coefficient (ICC) 22. A value close to 1 indicates excellent agreement between the two readings. In addition, the significance of the mean difference between the two readings was assessed using the paired t-test. All analyses were performed using SAS (Version 8, SAS Institute Inc., Cary, NC, USA) and a P value <0.05 was considered to indicate statistical significance.
Results
Intra-Observer Variability
Intraobserver reproducibility was excellent (IAT ICC 0.99; PAT ICC 0.99). Intra-thoracic and pericardial adipose tissue volume measurements were highly correlated between the two separate measurements by the same observer (r = .99; Figure 2a and r = .99; Figure 3a, respectively). The mean absolute and relative intra-observer differences were extremely small for both intra-thoracic and pericardial adipose tissue volume measurements (mean absolute difference: 6.24 ± 5.60 cm3 and 3.79 ± 3.00 cm3, respectively; and relative difference (mean variability): 4.34 ± 4.12% and 5.18 ± 5.19%, respectively).
Figure 2.

Intra-Thoracic Adipose Tissue Volume Intra-observer Correlation: Figure 2a is a scatter-plot demonstrating the linear correlation between observer 1 and observer 2 (r = 0.98, ICC = 0.98). Figure 2b is the Bland-Altman plot of the same data (Mean difference: −1.777 (CI −5.665 to 2.112), Range : 89.715 to 352.430, 95% Limits of agreement (Reference Range for difference): −18.393 to 14.840)
Figure 3.

Pericardial Adipose Tissue Volume Intra-observer Correlation: Figure 3a is a scatter-plot demonstrating the linear correlation between observer 1 and observer 2 (r = 0.99, ICC = 0.99). Figure 3b is the Bland-Altman plot of the same data (Mean difference: −0.317 (CI −2.609 to 1.975), Range: 27.250 to 181.960, 95% Limits of agreement (Reference Range for difference): −10.111 to 9.477)
Inter-Observer Variability
The interobserver reproducibility was excellent for IAT (ICC 0.98) and for PAT (ICC 0.98). The measurements were also highly correlated (r = 0.98 each, Figures 4a and 5a) and the mean absolute difference was small (10.92 ± 10.53 cm3 and 6.15 ± 5.71 cm3 for IAT and PAT, respectively). The mean variability was 6.23 ± 4.91% and 7.35 ± 7.22%, respectively. For both intra-thoracic and pericardial adipose tissue, variability of volume measurements increased with the volume of the adipose tissue measured (Figures 4b and 5b).
Figure 4.

Intra-Thoracic Adipose Tissue Volume Inter-observer Correlation: Figure 4a is a scatter-plot demonstrating the linear correlation between observer 1 and observer 2 (r = 0.98, ICC = 0.98). Figure 4b is the Bland-Altman plot of the same data (Mean difference: 3.161 (CI 0.209 to 6.112), Range: 49.735 to 377.415, 95% Limits of agreement (Reference Range for difference): −26.587 to 32.908)
Figure 5.

Pericardial Adipose Tissue Volume Inter-observer Correlation: Figure 5a is a scatter-plot demonstrating the linear correlation between observer 1 and observer 2 (r = 0.98, ICC = 0.98). Figure 5b is the Bland-Altman plot of the same data (Mean difference: −1.933 (CI −3.556 to −0.310), Range : 27.695 to 193.270, 95% Limits of agreement (Reference Range for difference): −18.295 to 14.429)
Effects of Heart Rate and Image Quality on Reproducibility
Both the mean difference of IAT and PAT between the two readers was not correlated with heart rate during the scan (r=0.06, p=0.59 and r=−0.04, p=0.74; respectively). Similarly, the mean difference of IAT and PAT between the two readers was similar between subjects with a heart rate of >65 as compared to subjects with a scan heart rate of <65 bpm (9.65+/−9.7 vs. 9.9+/−8.9, p=0.91 and 5.51+/−5.6 vs. 6.32+/−5.8, p=0.91; respectively).
There was no significant association in mean difference of IAT and PAT between the two readers with respect to image quality (p=0.11 and p=0.34; respectively). Also, the mean difference in IAT and PAT between the two readers was similar between subjects with exams graded as 4/5 as compared to exams graded <4 (10.1+/−10.1 vs. 12.8+/− 11.4, p=0.24 and 6.2+/−5.5 vs. 6.0+/−6.3, p=0.87; respectively).
Discussion
This study demonstrates excellent inter- and intra-observer reproducibility of semiautomatic measurements of pericardial and intra-thoracic adipose tissue volumes using high-resolution images from standard ECG-gated contrast-enhanced coronary CTA examinations.
While our results appear to be similar to those of a recent study12 using 4-slice, non-contrast-enhanced cardiac CT to measure intra-observer variability of PAT, it can be anticipated that the utilization of contrast-enhanced 64-slice CT technology creates a more accurate estimate of the true pericardial adipose tissue volume as compared to non-contrast-enhanced 4-slice CT. This can be attributed to improved spatial (0.6 mm) and temporal (165 ms) resolutions. It can also be assumed that the administration of contrast material will enhance the delineation of adipose tissue boundaries, enabling more accurate measurement. In their earlier study, Wheeler et al. evaluated the reproducibility of sequential non-contrast CT scans in 80 patients through a single observer. The investigators found that both measurements were highly correlated (r=0.99, p<0.0001) with a mean difference of 2.11±12.81 cm3. In the study, the authors did not perform an analysis of intra- and inter-observer variability. Our results on intra- and inter-observer variability of pericardial adipose tissue volume with contrast-enhanced exams are consistent with these initial observations, yet demonstrate a smaller variability (3.79 ± 3.00 vs. 2.11±12.81 cm3) indicating the higher accuracy of contrast-enhanced 64-slice CT measurements.
Measuring IAT and PAT volumes allows for a comparison of the possible differences in endocrine behavior of adipose tissue directly surrounding the myocardium (PAT) and the adipose tissue significantly removed from the myocardium. PAT in particular has been shown to be a rich source of inflammatory mediators in high-risk cardiac patients10. Recent studies in animal models have shown that inflammatory cytokines outside the coronary vasculature are capable of stimulating compositional changes within the intima23,24, with adventitial stress potentially diminishing the effect of endothelial nitric oxide 25,26. Given the close proximity of PAT and associated adipocytokines to the adventitia of the coronary arteries, a functional impact of the surrounding adipose tissue on coronary arteries may contribute to mechanisms of coronary artery disease. Early confirmation of this theory stems from a study in Japanese men which showed that PAT was more strongly associated with CAD morbidity in non-obese males than other body fat compartments11.
Thus, the ability to derive pericardial adipose tissue measurements at no extra radiation or contrast from CT datasets originally acquired for the evaluation of coronary artery plaque and stenosis may provide information on an additional risk factor for cardiovascular events. This manuscript forms the basis to investigate the clinical implications of the quantification of pericardial adipose tissue, but the clinical value of that quantification needs to be determined in further studies.
Limitations
In this study, we only report on the reproducibility of measurements of pericardial adipose tissue. We did not verify our measurements against a gold standard such as histopathology. However, previous studies have demonstrated the excellent accuracy of these methods.27, 28 Additionally, compared to non-contrast enhanced CT imaging, CTA is associated with higher radiation exposure and thus its use in cardiovascular risk stratification in asymptomatic subjects needs to be evaluated in the context of increased radiation exposure. Currently there are a number of novel approaches such as prospective scanning in order to reduce exposure to radiation29. Finally, our study sample is comprised of patients with acute chest pain and it is not entirely certain if such findings would be generalizable to other clinical settings. Further studies are needed to compare pericardial adipose tissue volume to CTA and calcium score findings as well as to other known metabolic and cardiovascular risk factors.
Conclusion
This study demonstrates the excellent intra- and inter-observer reproducibility of MDCT-based volumetric quantification of pericardial and intra-thoracic adipose tissue volumes using a 3D-based semiautomatic segmentation method. It remains to be determined whether volumetric measures of pericardial and intra-thoracic adipose tissue will provide information above and beyond more traditional measures of adiposity by providing new insights into the role of pericardial fat for the development of obesity-related disease conditions.
Table 2.
Inter- and intra-observer correlation
| Inter-Observer Variability | Intra-Observer Variability | |||||
|---|---|---|---|---|---|---|
| Mean Actual Difference | Percentage Difference (%) | ICC | Mean Actual Difference | Percentage Difference (%) | ICC | |
| PAT | 6.15 ± 5.71 cm3 | 7.35 ± 7.22% | 0.98 | 3.79 ± 3.00 cm3 | 5.18 ± 5.19% | 0.99 |
| IAT | 10.92 ± 10.53 cm3 | 6.23 ± 4.91% | 0.98 | 6.24 ± 5.60 cm3 | 4.34 ± 4.12% | 0.99 |
Acknowledgments
Funding Information: Internally Funded
Footnotes
Conflict of Interest: No author has a conflict of interest/financial disclosure
Contributor Information
John H. Nichols, Massachusetts General Hospital.
Bharat Samy, Brigham and Women’s Hospital.
Khurram Nasir, Massachusetts General Hospital.
Caroline S. Fox, Brigham and Women’s Hospital, The Framingham Heart Study.
P. Christian Schulze, New York-Presbyterian Hospital, Columbia University Medical Center.
Fabian Bamberg, Massachusetts General Hospital.
Udo Hoffmann, Massachusetts General Hospital.
References
- 1.Hu FB, SM, Manson JE, et al. Trends in the incidence of coronary heart disease and changes in diet and lifestyle in women. The New England Journal of Medicine. 2000;343(8):530–537. doi: 10.1056/NEJM200008243430802. [DOI] [PubMed] [Google Scholar]
- 2.Fox CS, EJ, Larson MG, Kannel WB, Levy D. Temporal trends in coronary heart disease mortality and sudden cardiac death from 1950 to 1999: the Framingham Heart Study. Circulation. 2004;110(5):522–527. doi: 10.1161/01.CIR.0000136993.34344.41. [DOI] [PubMed] [Google Scholar]
- 3.Flegal KM, CM, Kuczmarski RJ, Johnson CL. Overweight and obesity in the United States: prevalence and trends, 1960–1994. International Journal of Obesity Related Metabolic Disorders. 1998;22(1):39–47. doi: 10.1038/sj.ijo.0800541. [DOI] [PubMed] [Google Scholar]
- 4.Hubert HB, FM, McNamara PM, Castelli WP. Obesity as an independent risk factor for cardiovascular disease: a 26-year follow-up of participants in the Framingham heart study. Circulation. 1983;67:968–77. doi: 10.1161/01.cir.67.5.968. [DOI] [PubMed] [Google Scholar]
- 5.Barrett-Connor E. Obesity, atherosclerosis, and coronary artery disease. Annals of Internal Medicine. 1985;103:1010–19. doi: 10.7326/0003-4819-103-6-1010. [DOI] [PubMed] [Google Scholar]
- 6.Rosenbaum M, LR, Hirsch J. Obesity. The New England Journal of Medicine. 1997;337:396–407. doi: 10.1056/NEJM199708073370606. [DOI] [PubMed] [Google Scholar]
- 7.Poirier P, DJ Waist circumference, visceral obesity, and cardiovascular risk. Cardiopulmonary Rehabilitation. 2003;23(3):161–169. doi: 10.1097/00008483-200305000-00001. [DOI] [PubMed] [Google Scholar]
- 8.Fox CS, MJ, Hoffmann U, Pou KM, Maurovich-Horvat P, Liu CY, Vasan RS, Murabito JM, Meigs JB, Cupples LA, D'Agostino RB, Sr, O'Donnell CJ. Abdominal visceral and subcutaneous adipose tissue compartments: association with metabolic risk factors in the Framingham Heart Study. Circulation. 2007;116(1):39–48. doi: 10.1161/CIRCULATIONAHA.106.675355. [DOI] [PubMed] [Google Scholar]
- 9.Jeong JW, JM, Yun KH, Oh SK, Park EM, Kim YK, Rhee SJ, Lee EM, Lee J, Yoo NJ, Kim NH, Park JC. Echocardiographic epicardial fat thickness and coronary artery disease. Circulation. 2007;71(4):536–9. doi: 10.1253/circj.71.536. [DOI] [PubMed] [Google Scholar]
- 10.Mazurek T, ZL, Zalewski A, et al. Human epicardial adipose tissue is a source of inflammatory mediators. Circulation. 2003;(108):2460–66. doi: 10.1161/01.CIR.0000099542.57313.C5. [DOI] [PubMed] [Google Scholar]
- 11.Taguchi R, TJ, Itani Y, et al. Pericardial fat accumulation in men as a risk factor for coronary artery disease. Atherosclerosis. 2001;157:203–9. doi: 10.1016/s0021-9150(00)00709-7. [DOI] [PubMed] [Google Scholar]
- 12.Wheeler GL, SR, Beck SR, et al. Pericardial and visceral adipose tissue measured volumetrically with computed tomography are highly associated in type 2 diabetic families. Investigative Radiology. 2005;40(2):97–101. doi: 10.1097/00004424-200502000-00007. [DOI] [PubMed] [Google Scholar]
- 13.Iacobellis G, LF Epicardial adipose tissue and insulin resistance in obese subjects. The Journal of Clinical Endocrinology and Metabolism. 2005;90(11):6300–2. doi: 10.1210/jc.2005-1087. [DOI] [PubMed] [Google Scholar]
- 14.Yoshizumi T, NT, Mitsukazu Y, et al. Abdominal fat: standardized technique for measurement at CT. Radiology. 1999;211:283–6. doi: 10.1148/radiology.211.1.r99ap15283. [DOI] [PubMed] [Google Scholar]
- 15.Kobayashi J, TN, Watanabe M, et al. A novel method of measuring intra-abdominal fat volume using helical computed tomography. International Journal of Obesity Related Metabolic Disorders. 2002;26:398–402. doi: 10.1038/sj.ijo.0801921. [DOI] [PubMed] [Google Scholar]
- 16.Hoffmann U, NJ, Moselewski FM, et al. Coronary multidetector computed tomography in the assessment of patients with acute chest pain. Circulation. 2006;114(21):2251–60. doi: 10.1161/CIRCULATIONAHA.106.634808. [DOI] [PubMed] [Google Scholar]
- 17.Hoffmann MH, et al. Noninvasive coronary angiography with multislice computed tomography. JAMA. 2005;293(20):2471–8. doi: 10.1001/jama.293.20.2471. [DOI] [PubMed] [Google Scholar]
- 18.Austen WG, Edwards JE, Frye RL, et al. A reporting system on patients evaluated for coronary artery disease. Report of the Ad Hoc Committee for Grading of Coronary Artery Disease, Council on Cardiovascular Surgery, American Heart Association. Circulation. 1975;51:5–40. doi: 10.1161/01.cir.51.4.5. [DOI] [PubMed] [Google Scholar]
- 19.Leschka S, Wildermuth S, Boehm T, et al. Noninvasive coronary angiography with 64-section CT: effect of average heart rate and heart rate variability on image quality. Radiology. 2006;241:378–385. doi: 10.1148/radiol.2412051384. [DOI] [PubMed] [Google Scholar]
- 20.Shim SS, Kim Y, Lim SM. Improvement of image quality with beta-blocker premedication on ECG-gated 16-MDCT coronary angiography. AJR Am J Roentgenol. 2005;184:649–654. doi: 10.2214/ajr.184.2.01840649. [DOI] [PubMed] [Google Scholar]
- 21.Herzog C, Nguyen SA, Savino G, et al. Does two-segment image reconstruction at 64-section CT coronary angiography improve image quality and diagnostic accuracy? Radiology. 2007;244:121–129. doi: 10.1148/radiol.2441060004. [DOI] [PubMed] [Google Scholar]
- 22.Shrout PE, FJ Intraclass Correlations: Uses in Assessing Rater Reliability. Psychological Bulletin. 1979;2:420–428. doi: 10.1037//0033-2909.86.2.420. [DOI] [PubMed] [Google Scholar]
- 23.Miyata K, SH, Kandabashi T, et al. Rho-kinase is involved in macrophage-mediated formation of coronary vascular lesions in pigs in vivo. Arteriosclerosis, Thrombosis, and Vascular Biology. 2000;20:2351–58. doi: 10.1161/01.atv.20.11.2351. [DOI] [PubMed] [Google Scholar]
- 24.Shimokawa H, IA, Fukumoto Y, et al. Chronic treatment with interleukin-1β induces coronary intimal lesions and vasospastic responses in pigs in vivo. The Journal of Clinical Investigations. 1996;97:769–76. doi: 10.1172/JCI118476. [DOI] [PMC free article] [PubMed] [Google Scholar]
- 25.Pagano PJ, CJ, Cifuentes-Pagano ME, et al. Localization of a constitutively active, phagocyte-like NADPH oxidase in rabbit aortic adventitia: enhancement by angiotensin II. Proceedings of the National Academy of Sciences. 1997;94:14483–88. doi: 10.1073/pnas.94.26.14483. [DOI] [PMC free article] [PubMed] [Google Scholar]
- 26.Wang HD, PP, Du Y, et al. Superoxide anion from the adventitia of the rat thoracic aorta inactivates nitric oxide. Circulation Research. 1998;82:810–8. doi: 10.1161/01.res.82.7.810. [DOI] [PubMed] [Google Scholar]
- 27.Hirooka M, KT, Kurose K, Nakanishi S, Michitaka K, Matsuura B, Horiike N, Onji M. A technique for the measurement of visceral fat by ultrasonography: comparison of measurements by ultrasonography and computed tomography. Internal Medicine. 2005;44(8) doi: 10.2169/internalmedicine.44.794. [DOI] [PubMed] [Google Scholar]
- 28.Stolk RPWO, Zelissen PM, Meijer R, van Gils AP, Grobbee DE. Validity and reproducibility of ultrasonography for the measurement of intra-abdominal adipose tissue. International journal of obesity and related metabolic disorders : journal of the International Association for the Study of Obesity. 2001;25(9) doi: 10.1038/sj.ijo.0801734. [DOI] [PubMed] [Google Scholar]
- 29.Shuman WP, Branch KR, May JM, Mitsumori LM, Lockhart DW, Dubinsky TJ, Warren BH, Caldwell JH. Prospective versus Retrospective ECG Gating for 64-Detector CT of the Coronary Arteries: Comparison of Image Quality and Patient Radiation Dose. Radiology. 2008 Jun 13; doi: 10.1148/radiol.2482072192. [DOI] [PubMed] [Google Scholar]