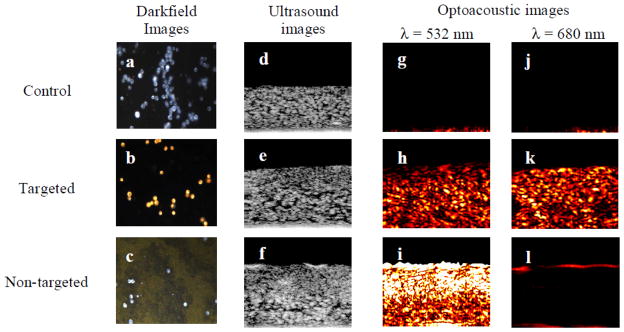
Figure 4.
Darkfield, ultrasound and photoacoustic images (λ = 532 nm and 680 nm) of control, targeted and non-targeted tissue phantoms. The darkfield images measure 440 μm by 340 μm field of view. The ultrasound and optoacoustic images measure 2 mm by 1.67 mm. The targeted EGFR cells show high photoacoustic signal due to the plasmon resonance coupling resulting from clustering gold nanoparticles. Reproduced from Mallidi S, Larson T, Aaron J, et al. Molecular specific optoacoustic imaging with plasmonic nanoparticles. Opt Express 2007 May 28;15(11):6583–8 with permission of the Optical Society of America. [27]

