
Figure 2.
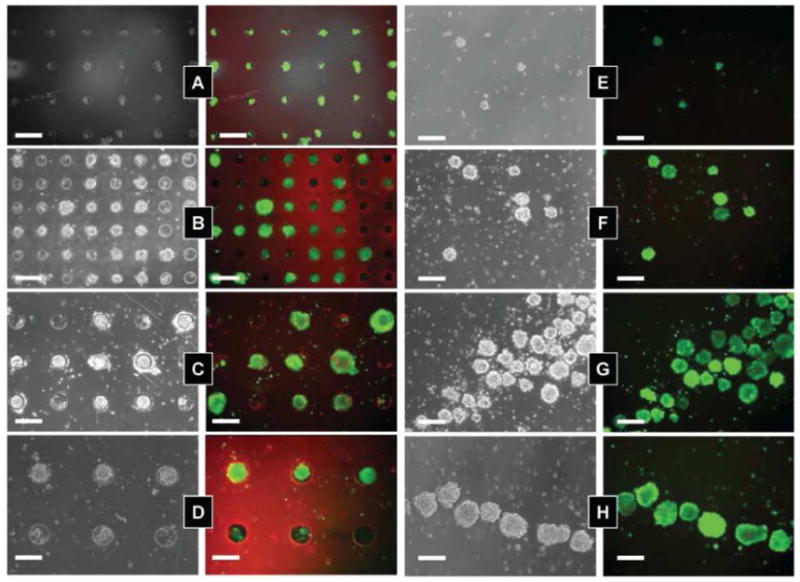
ES cells seeded in microwells of varying size: (A) 40 μm; (B) 75 μm; (C) 100 μm; and (D) 150 μm. Fluorescent images show cell stained with calcein AM (live cells) and ethidium homodimer (dead cells) after 10 days of culturing. (E–H) Harvested cell aggregates after 10 days of culture. Images reproduced with permission.23