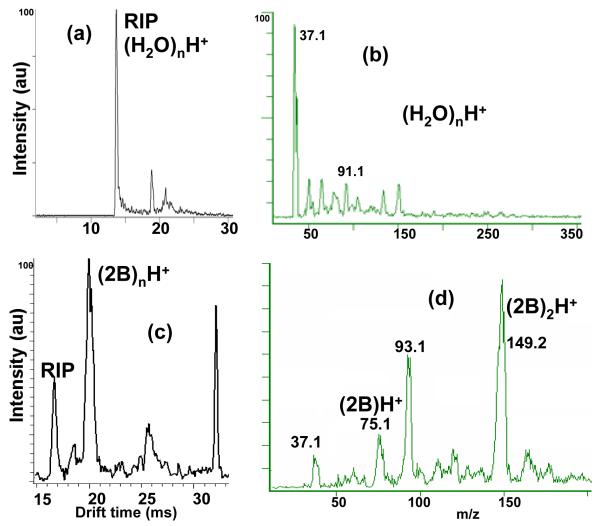
Figure 2. Clustering of the reactant ion peaks with 2-butanol, and clusters of 2-butanol.
IMS (a and c) and MS spectra (b and d) of the ESI solvent in pure nitrogen (a and b), and when 1.7 mmol m−3 of 2-butanol was injected into the buffer gas (c and d). The reactant ion peak, (H2O)nH+ , appeared at 13.7 ms in (a). The IMS peaks are broadened and shifted to lower mobilities in (c) due to interactions with the modifier. The peak at 32 ms in (c) is due to a contaminant at m/z 371.

