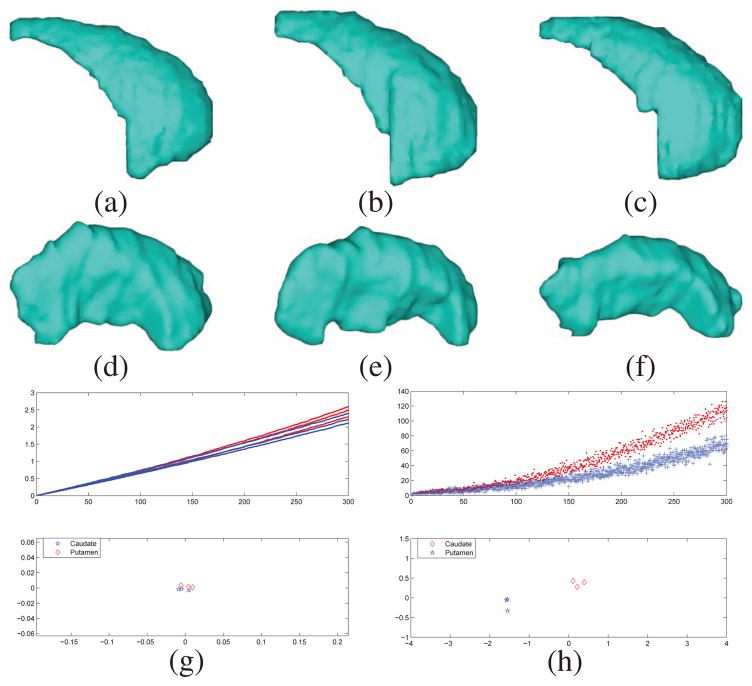
Fig. 2.
(a)(b)(c) Caudate surfaces. (d)(e)(f) Putamen. (g) Top: the first 300 eigenvalues of the 6 shapes. Bottom: MDS embedding results with the shape DNA. (h) Top: The first 300 nodal counts of the 6 shapes. Bottom: MDS embedding results with the nodal count sequences. (red: caudate; blue: putamen.)

