
Figure 2. Abstinence rates by treatment group based upon intent-to-treat and completer samples.
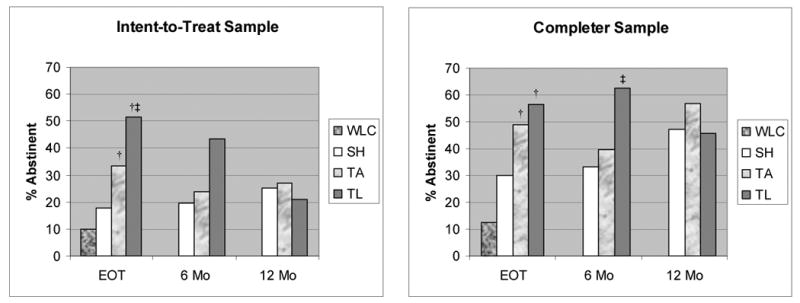
† p < .008 vs.WLC
‡ p < .008 vs. SH
WLC = Wait-list control, SH = Self-help, TA = Therapist-assisted, TL = Therapist-led
EOT = End of treatment, 6 Mo = 6-month follow-up, 12 mo = 12-month follow-up