
Figure 1.
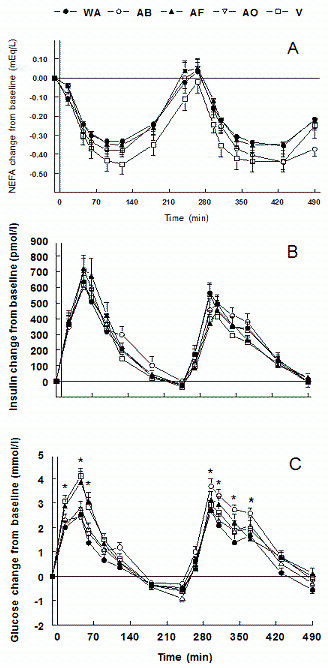
A) Daylong NEFA concentrations as change from baseline; B) Daylong insulin concentrations as change from baseline; C) Daylong glucose concentrations as change from baseline (*P < 0.05). black circles = WA (whole almonds); white circles = AB (almond butter); black triangles = AF (almond flour); white triangles = AO (almond oil); white squares = V (vehicle).