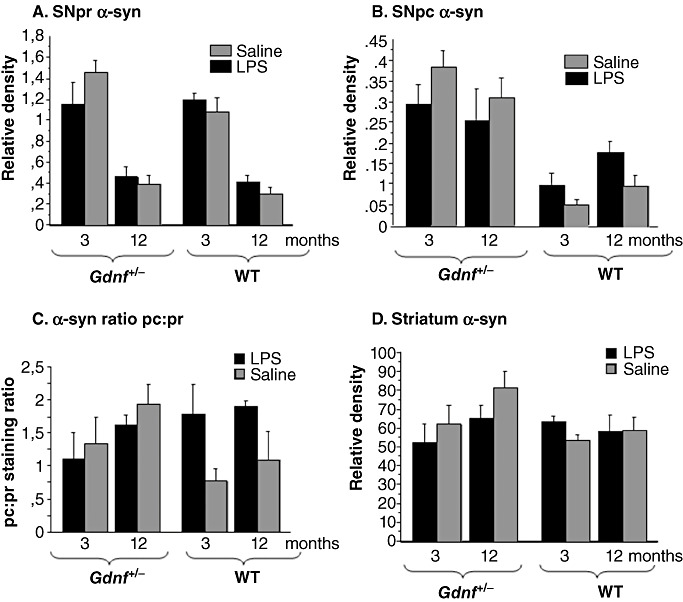
Figure 8.

α‐syn densitometry revealed age‐ and genotype differences in staining. Densitometry was performed on α‐syn‐immunoreactive (ir) sections throughout the longitudinal axis of the substantia nigra (SN) and striatum. In pr (A), immunoreactivity to the α‐syn antibodies declined significantly with age in all groups (P < 0.001). B. The lipopolysaccharide (LPS) treatment in the pc of the wild‐type (WT) mice gave rise to a similar significant increase in SNpc α‐syn, compared with WT saline‐treated mice (P < 0.05), and the partial gene deletion of Gdnf lead to increased SNpc α‐syn in both groups (genotype effect: P < 0.001; genotype–treatment interaction P < 0.05), regardless of age. These data present an interesting relationship between LPS treatment and Gdnf deletion, and point to a complicated relationship between expression, transportation or degradation of this protein in our model. C. α‐syn staining ratio between the SNpc and pr. Note that the relative distribution of α‐syn staining is increased gradually with age in Gdnf +/− mice, and in WT mice with prenatal LPS treatment of both ages. There was a significant genotype–treatment interaction [(1,38); F = 5 708; P < 0.0114] of pc:pr in the SN. D. Densitometry of α‐syn immunostaining in the striatum at all ages showed no significant differences, even though a gradual increase in staining density was observed in Gdnf +/− mice across age, similar to what was observed for the ratio in (C).
