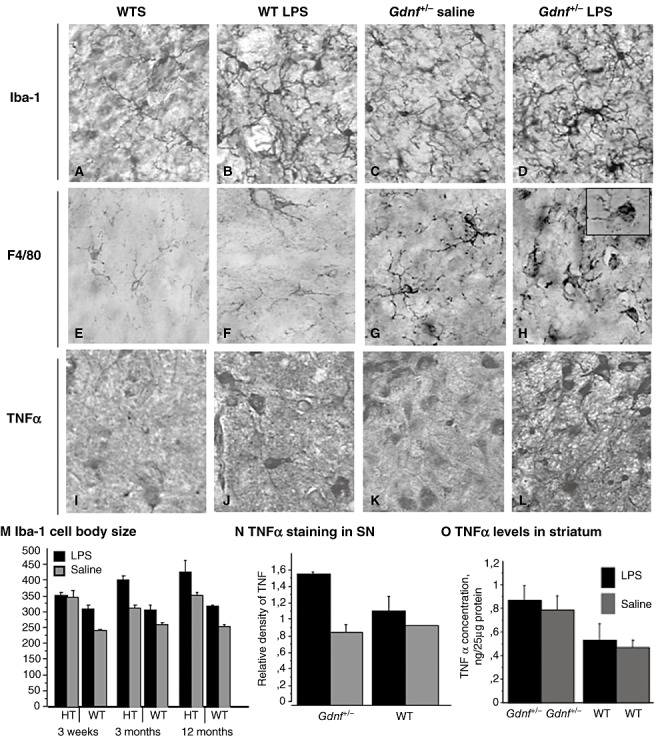
Figure 9.

Long‐term activation of microglial cells in the substantia nigra (SN) with prenatal lipopolysaccharide (LPS) treatment. The images are generated from sections of the SN from all four groups at 12 months of age incubated with Iba‐1 (A–D), a marker for activated microglia, F4/80 (E–H), and tumor necrosis factor alpha (TNFα) (I–L). As can be seen here, microglial activation, as seen with the increased cell body size and increased arborizations, and increased staining of F4/80, is enhanced in LPS‐treated mice of both genotypes, but the activation is further increased in mice with a partial Gdnf deletion combined with LPS (D, H, L). M. For Iba‐1 cell body area in the SN there was a significant age × treatment–genotype interaction [(2,40); F = 4.442; P < 0.0181] and individual effects of age [(2,40); F = 4.158; P < 0.05], genotype [(1,40); F = 139.581; P < 0.001] and treatment [(1,40); F = 66.828; P < 0.001]. N. The staining ratio for TNFα staining in SN revealed a significant genotype × treatment effect [F = 647.990; P < 0.0396] and a significant treatment effect [F = 1673.570; P < 0.01], but no effect of genotype (P > 0.15). O. TNFα levels in SN tissue samples revealed a step‐wise increase in levels of this pro‐inflammatory cytokine, and levels were highest in the Gdnf +/−‐ LPS group, as seen in the bar graph. Abbreviations: WT = wild type; WTS = wild type saline.
