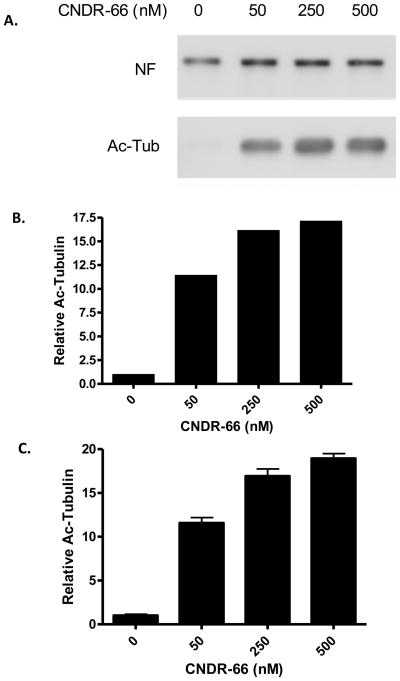
Figure 2.
Validation of the acetyl-tubulin ELISA. PC12 cell cultures were treated for 24 hours with various doses of CNDR-66 and (A) aliquots of the cell homogenates were analyzed by SDS-PAGE followed by immunoblotting, with detection of acetyl-tubulin (Ac-Tub) and neurofilament medium chain (NF). The immunoblot underwent densitometric analysis, with acetyl-tubulin values normalized to the corresponding NF values for each treatment condition. These normalized values were then compared to that obtained for the vehicle-treated cultures to obtain relative acetyl-tubulin levels (B). Additional aliquots of the PC12 cell homogenates were used in the acetyl-tubulin ELISA. ELISA values obtained from cell homogenates after CNDR-66 treatment were normalized to the corresponding values from vehicle-treated cultures to obtain relative acetyl-tubulin values (C). Error bars = SEM.

