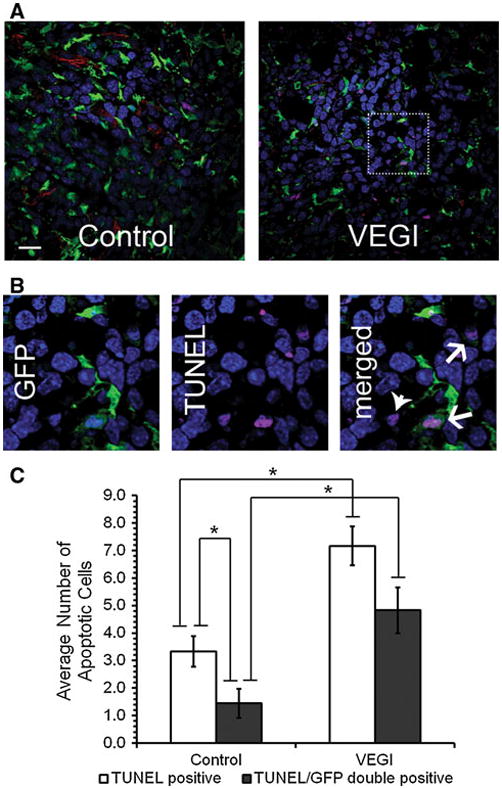
Fig. 4.

Induction of apoptosis of BM-derived cells by VEGI-treatment a Representative confocal images of Day 7 LLC tumor samples analyzed for apoptosis. Green, GFP; Red, CD31; Magenta, TUNEL; Blue, Dapi; Scale bar 20 μm. b High magnification of the boxed area shown in Panel A. TUNEL positive cells (arrow heads) and GFP+-TUNEL+ cells (arrows) are indicated. c Average number of TUNEL positive cells per field in vehicle-treated control or VEGI-treated tumors. A minimum of 10 fields per tumor sample were counted from each animal (n = 4 per group)
