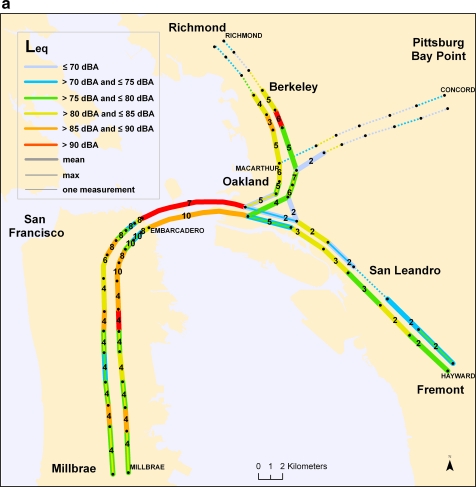
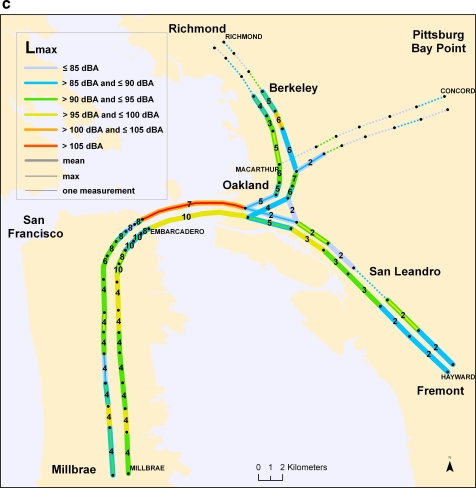
Figure 1.
a Map of mean and maximum Leq (dBA). b Map of mean and maximum Lpeak (dB). c Map of mean and maximum Lmax (dBA). The number of observations is overlaid on each line segment, except those with a single measurement. The shape and position of line segments have been distorted to facilitate visual discrimination and should be interpreted as schematic.


