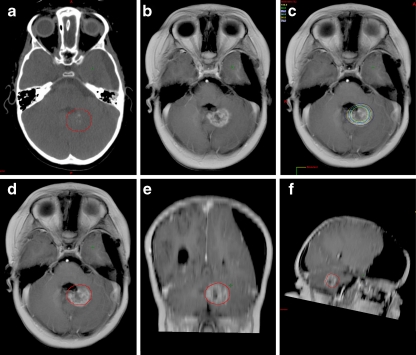
Fig. 4.
Extent of tumor enlargement corresponding to isodose curves on planning CT. a Planning target volume on the original planning CT for a patient with an ATRT (patient 11). b Follow-up MRI scan at 6 months post-SRS with extensive edema. c The same MRI scan as in b after registering it with the original planning CT and displaying isodose curves. d–f Axial, coronal, and sagittal views of the 6-month follow-up MRI registered with the planning CT and displaying the 16 Gy line (80% isodose curve)

