
Fig. 2.
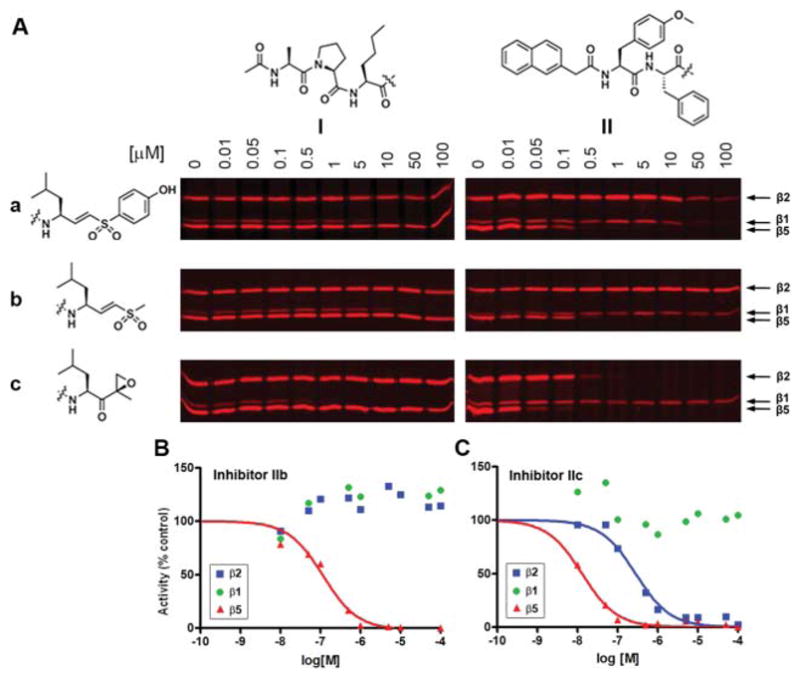
Proteasome profiling screen of the hybrids Ia–c and IIa–c using MV151. (A) HEK293T lysates (10 μg total protein) were incubated with the indicated concentrations of compounds Ia–c and IIa–c for 1 h at 37 °C. The residual proteasome activity was fluorescently labeled by incubation with 1 μM MV151 for 1 h at 37 °C. (B–C) The fluorescent band intensity for each subunit was quantified to give competition curves as shown in (B) for IIb and in (C) for IIc.