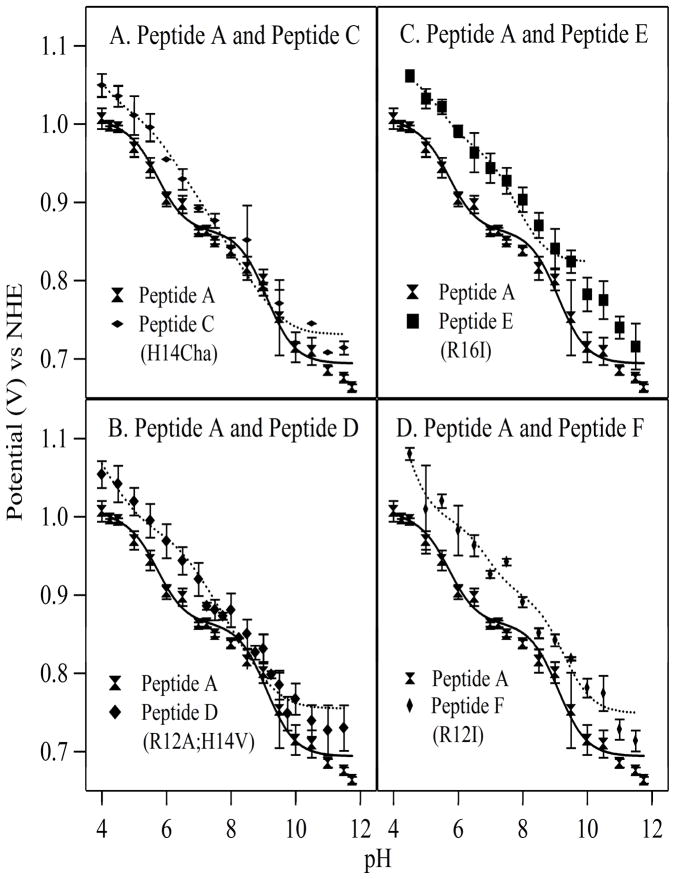
Figure 4.
Electrochemical titrations of beta hairpin peptides. The titration curve of peptide A is shown in each panel with a fit superimposed as a solid line (Table 1). The panels also show data acquired from (A) peptide C (H14Cha), (B) peptide D (H14V; R12A), (C) peptide E (R16I), and (D) peptide F (R12I), with fits superimposed as dotted lines. The error bars represent one standard deviation. See Table 1 for fit parameters and Materials and Methods for spectral conditions.

