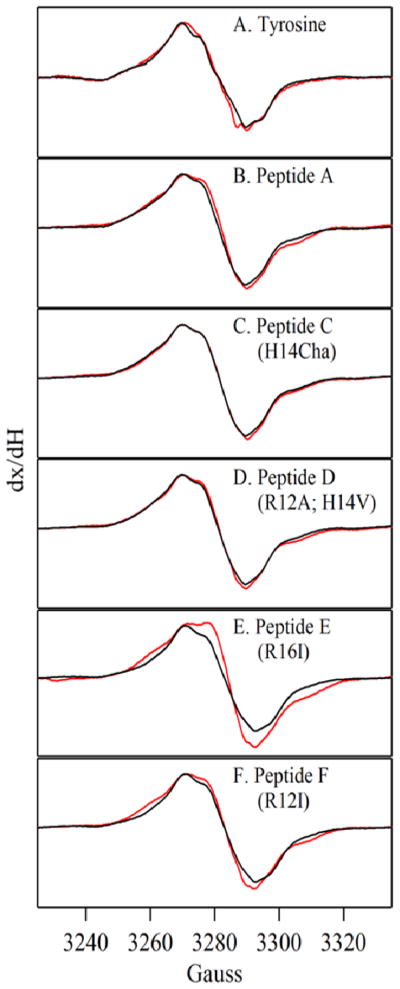
Figure 5.
EPR spectra of tyrosyl radicals in beta hairpin peptides at pH 5.0 (red) and 11.0 (black). The radicals were generated by UV photolysis at 108 K. The panels show spectra acquired from (A) tyrosine, (B) peptide A, (C) peptide C (H14Cha), (D) peptide D (H14Val; R12A), (E) peptide E (R16I), and (F) peptide F (R12I). To compare spectral linewidth, the spectra were normalized for any amplitude differences. See Materials and Methods for spectral conditions.

