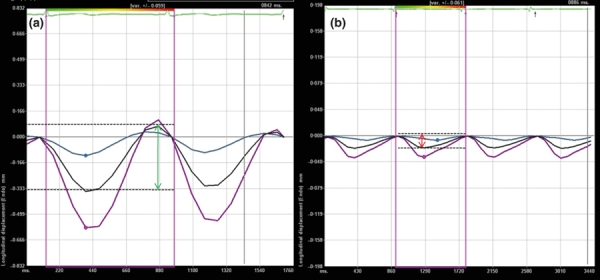
Figure 3.

Shows detailed examples from the output of the VVI-software. Displayed are the longitudinal displacement curves during heart cycles. The blue and purple curves correspond to the common carotid artery far wall; the black curve is the average of the blue and purple curves. The purple vertical lines denote the measured cardiac cycle. The ECG recording can be seen above the displacement curves. (a) Displays a normal longitudinal wall motion of the CCA far wall in a healthy volunteer. The green arrow indicates tLoD, which in this patient was found to be 0·438 mm. (b) Shows a patient with low tLoD. The red arrow indicates the tLoD to be 0·019 mm.
