Figure 4.

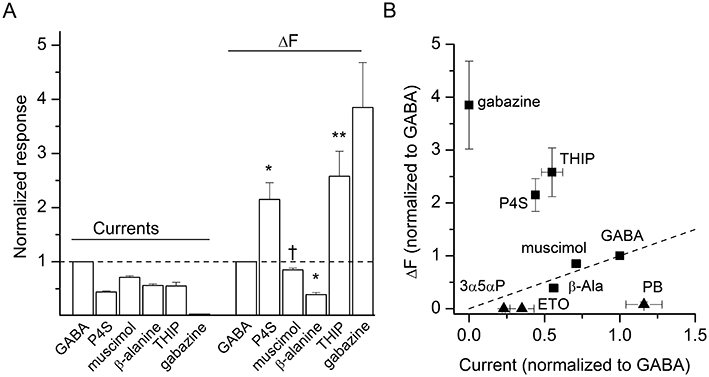
Occupation of the GABA site results in fluorescence changes (ΔF). (A) Comparison of current and ΔF from oocytes exposed to 1 mM GABA, 1 mM piperidine-4-sulphonic acid (P4S), 100 µM muscimol, 20 mM β-alanine, 10 mM 4,5,6,7-tetrahydroisoxazolo[5,4-c]pyridin-3-ol (THIP), or 50 µM gabazine. The responses are normalized to those to GABA. Gabazine elicited no current response, but exhibited the largest ΔF. Statistical analysis was conducted on a parameter R (calculated as relative ΔF/relative current). Significance levels apply to comparison with the data obtained in the presence of GABA. *P < 0.05; **P < 0.01; †not significant. For gabazine, due to lack of currents R could not be calculated. (B) The normalized ΔF is plotted as a function of normalized current response. For comparison, data for non-GABA site ligands pentobarbital (PB, 1 mM), allopregnanolone (3α5αP, 10 µM) and etomidate (ETO, 5 µM) are shown with triangles. The dashed line goes from no response to the GABA point (slope of 1).
