
Figure 5.
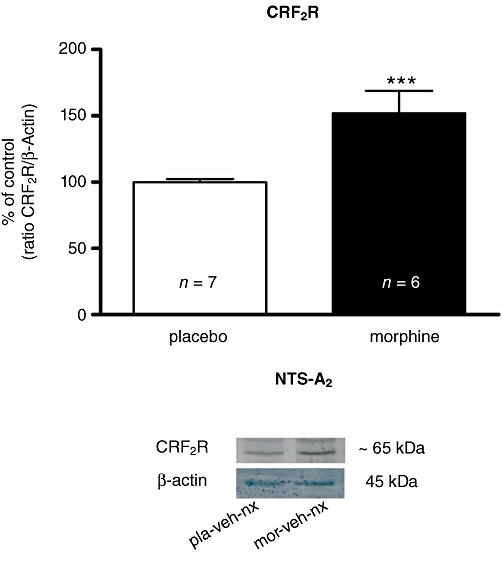
Representative immunoblots of CRF2 expression in NTS tissue isolated from control pellets-treated (placebo) or morphine-dependent rats 30 min after administration of naloxone. β-Actin was used as loading control. Data represent the optical density of immunoreactive bands expressed as a percentage (%) of the mean ± SEM of placebo control band. ***P < 0.001 versus control group. CRF2, corticotropin-releasing factor type-2 receptor; NTS, nucleus of the solitary tract; veh, vehicle; nx, naloxone; pla, placebo; mor, morphine.