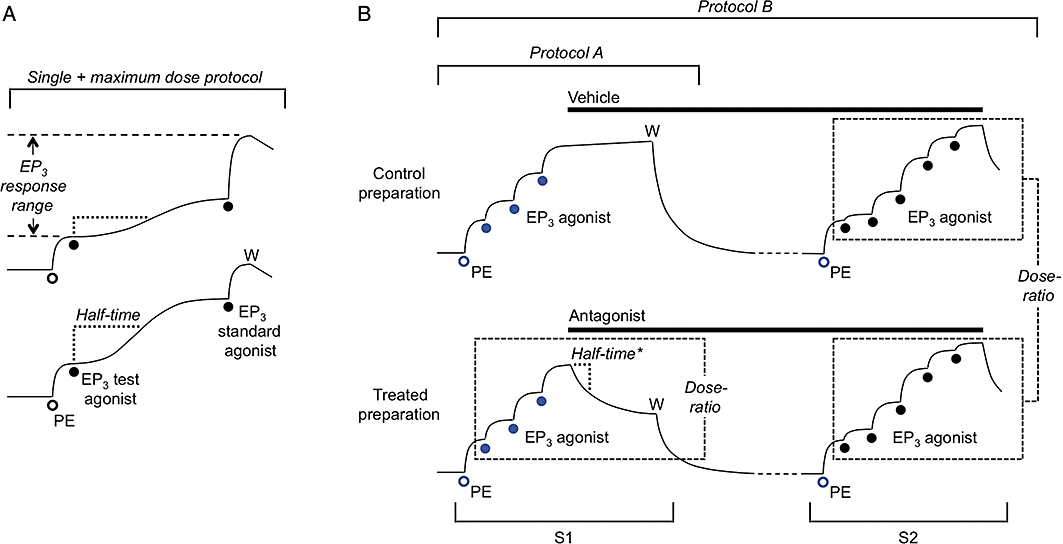
Figure 2.

Cartoon showing protocols for isolated smooth muscle assays: in each case for guinea-pig aorta EP3 assay involving priming with phenylephrine (PE, open circles) in each cumulative agonist sequence. (A) Single + maximum dose protocol used for a slow-acting agonist. pEC50 for test agonist was derived from the mid-portion of its log concentration–response curve, which was obtained by applying single doses to individual preparations followed by a maximal dose of the standard agonist. Individual half-times were used to calculate an onset half-time corresponding to E50 (T50). (B) Antagonist protocols. Protocol A is a type of inhibition-curve protocol: the steady-state inhibition was converted into a dose-ratio (and corresponding pA2 value) using the three (EP3) agonist responses in sequence 1 (S1); a corresponding onset half-time (half-time*) was calculated from a dose-ratio – time plot. Protocol B is a Schild protocol: following washout of S1 primer/agonist (W), vehicle and antagonist treatments were continued before construction of agonist curves in S2; between-preparations dose-ratios were obtained for Schild analysis. Two additional preparations were usually treated with different concentrations of antagonist. The blue symbols indicate responses used in repeated-measures 2-factor anova (aorta EP3 assay only) to investigate matching of preparations in S1 and the effect of antagonist treatment on the priming response in S2.
