
Figure 4.
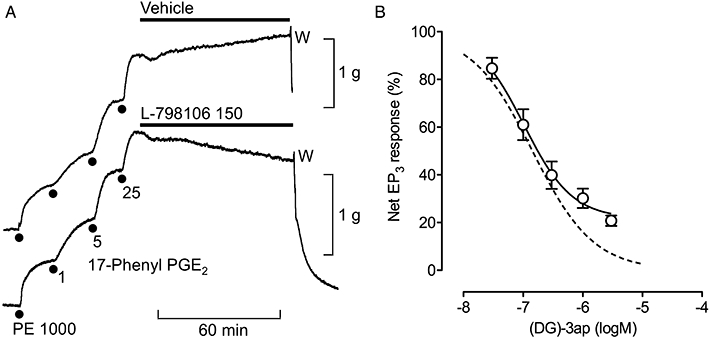
Inhibitory profiles of EP3 antagonists on guinea-pig aorta. Using protocol A, contraction was established with 25 nM 17-phenyl PGE2 under phenylephrine (PE) priming in the presence of the TP antagonist BMS-180291 (300 nM). (A) Slowly developing antagonism by L-798106; the transient initial fall in tension in both records is a typical effect of the vehicle (14 mM DMSO). Concentrations in nM; W, wash. (B) Non-cumulative log concentration–inhibition curve for (DG)-3ap. The broken line is a predicted curve for complete inhibition of the net EP3 response corresponding to a pA2 of 7.92 for (DG)-3ap (protocol B) and nH of 0.85 for 17-phenyl PGE2. Vertical bars show SEM (n= 4–5).