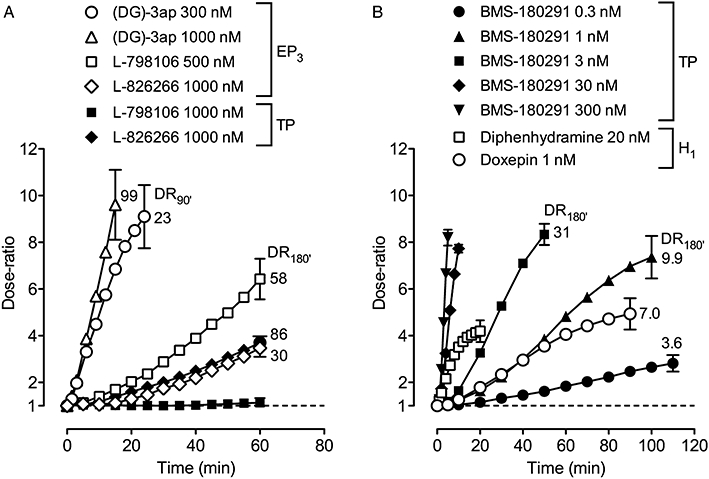
Figure 5.

Onset rates for antagonists on guinea-pig aorta under protocol A presented as dose-ratio – time plots: (A) EP3 antagonists versus 17-phenyl PGE2 and U-46619; (B) TP antagonist BMS-180291 versus U-46619 and H1 antagonists diphenhydramine and doxepin versus histamine. For clarity, SEM (n= 4–5) for each final time-point only is shown. The value adjacent to a curve is the mean dose-ratio achieved after continuation of antagonist treatment for a total of 90 min (DR90′) or 180 min (DR180′) under protocol B. BMS-180291 (300 nM) was present throughout the EP3 measurements in (A).
