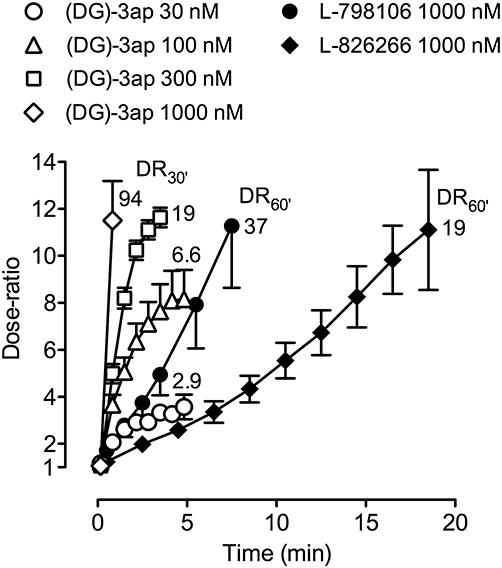
Figure 7.

Onset rates of EP3 antagonists on guinea-pig vas deferens presented as dose-ratio – time plots. Under protocol A, inhibition of electrical field stimulation twitch contraction induced by 15 nM prostaglandin E2 was reversed by antagonist application. Vertical bars show SEM (all n= 4). The first two data points on each (DG)-3ap curve correspond to 10 and 50 s after antagonist addition. The value adjacent to each curve is the mean dose-ratio achieved after continuation of antagonist treatment for a total of 30 min (DR30′) or 60 min (DR60′) under protocol B.
