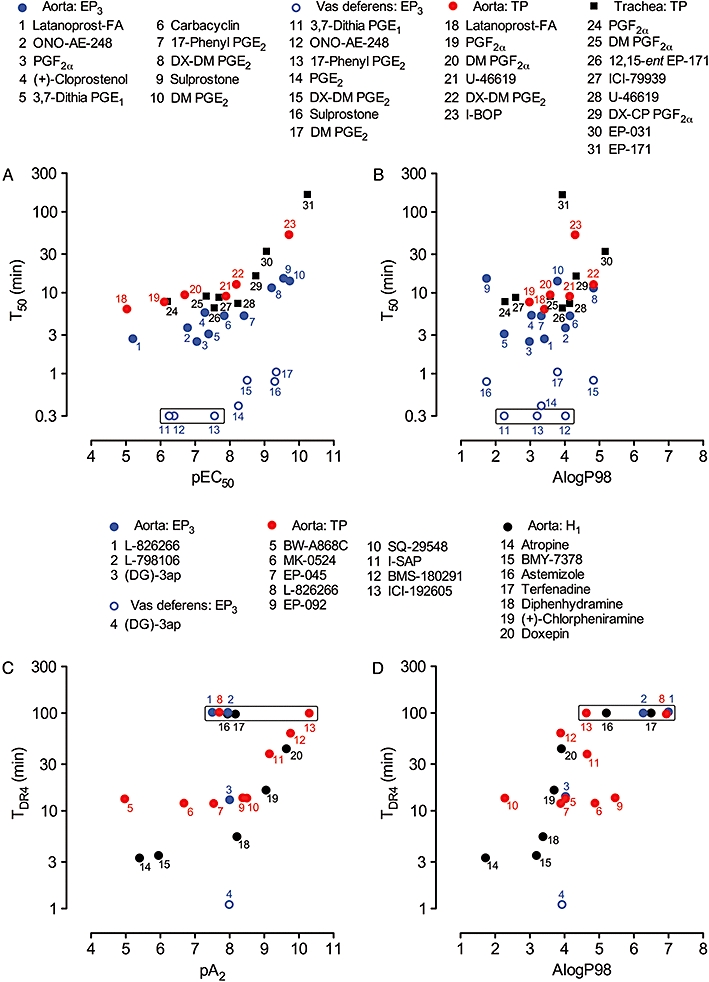
Figure 8.

Correlations between onset rate and potency/affinity and between onset rate and lipophilicity on guinea-pig isolated smooth muscle preparations. Upper panels: plots of T50 versus (A) pEC50 and (B) AlogP98 for EP3 and TP agonists. Data points in each box indicate that responses were too rapid for accurate estimation of T50 (arbitrary location on 0.3 min level). Lower panels: plots of TDR4 versus (C) pA2 and (D) AlogP98 for EP3, TP and H1 antagonists. Data points in each box indicate that antagonism was too slow for TDR4 to be obtained (arbitrary location on 100 min level). L-798106 and L-826266 had slow onsets on the vas deferens EP3 system: see text. PGE2, prostaglandin E2; T50, onset half-time for an agonist to achieve 50% maximal response; TDR4, onset half-time for an antagonist corresponding to a dose-ratio of 4.
